

Free - 7x4 Table for PowerPoint and Google Slides
Free - 7x4 Table for PowerPoint and Google Slides
(1 Editable Slide)
Product Details
(1 Editable Slide)
Available For
PowerPoint
Keynote
Google Slides
Canva Slides
Animation:
Yes
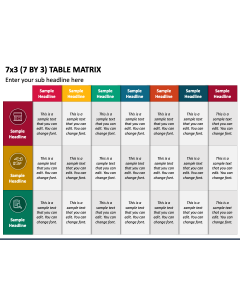
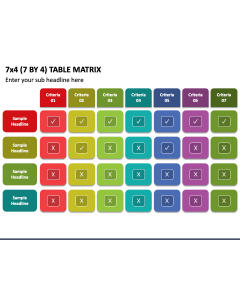
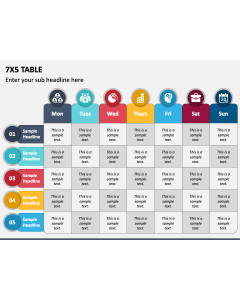
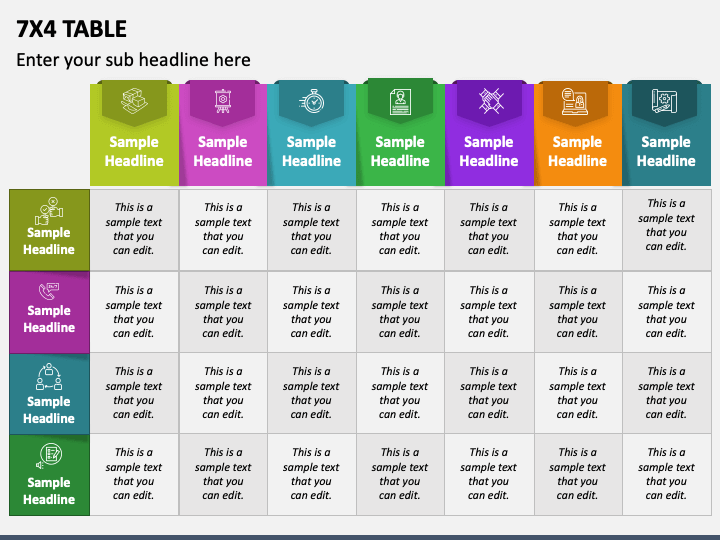
Give your information a structured look and a vibrance to your presentation with our 7x4 Table slide for MS PowerPoint and Google Slides. It is loaded with a tabular illustration of seven columns and four rows with editable text placeholders. Finance experts and investment advisors can leverage this multi-use infographic to represent the financial performance of different companies, comparison of various investment options, and much more. Project managers can use this illustration in their presentations to portray the status of their multiple projects in an organized way. Further, you can illustrate product comparisons, market trends, performance metrics, risk assessments, etc.
Distinctive Features
- Fully customizable slide
- High-definition illustration
- Copyright-safe
- Reusable for an indefinite period
- 24-hour support and assistance
Get this PPT now to present in style!