


Similar Products
-

-
- Sale
- Sale
- Sale
- Sale


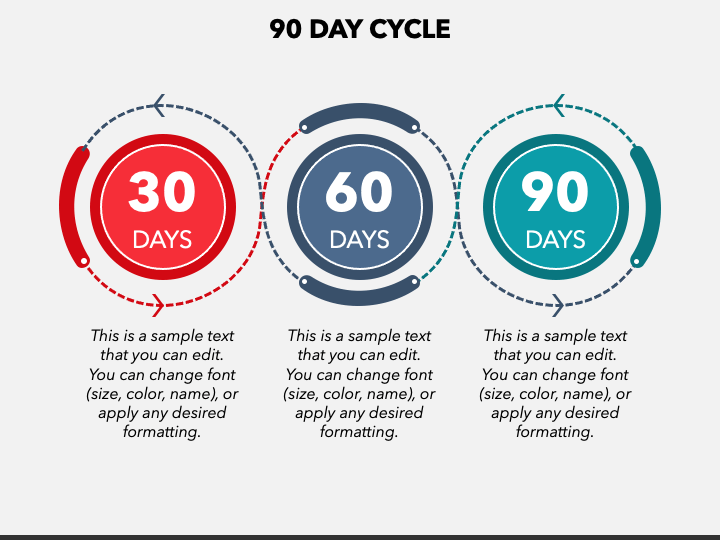
Our 90 Days Cycle presentation graphic for PowerPoint and Google Slides is the perfect visual resource to portray the course of action for the next three months. The slide features an infographic of three circles representing 30, 60, and 90 days. It also has editable text placeholders to put the desired textual information.
Sales professionals can use this multipurpose graphic to showcase the sales objectives for the upcoming three months and strategies to accomplish them. Marketers can also use this visual to illustrate the marketing tactics and strategies to implement in the forthcoming quarter. Additionally, you can present the training plan for onboarding new recruits, financial targets for the upcoming 30, 60, and 90 days, and more.
Features
- The users can conveniently modify the graphic irrespective of their technical know-how.
- The visual quality won’t get disturbed, even when projected on a widescreen.
- The illustration has been designed from scratch to ensure no user experiences copyright issues.
Download this PPT today without thinking twice!
Write Your Own Review

Related Products


