


Similar Products
- Sale

-
-
- Sale
- Sale
- Sale

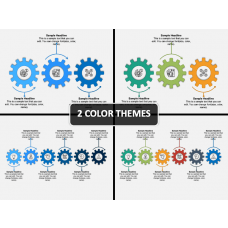
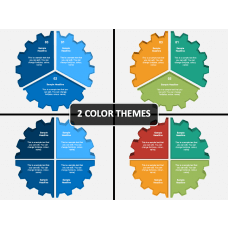


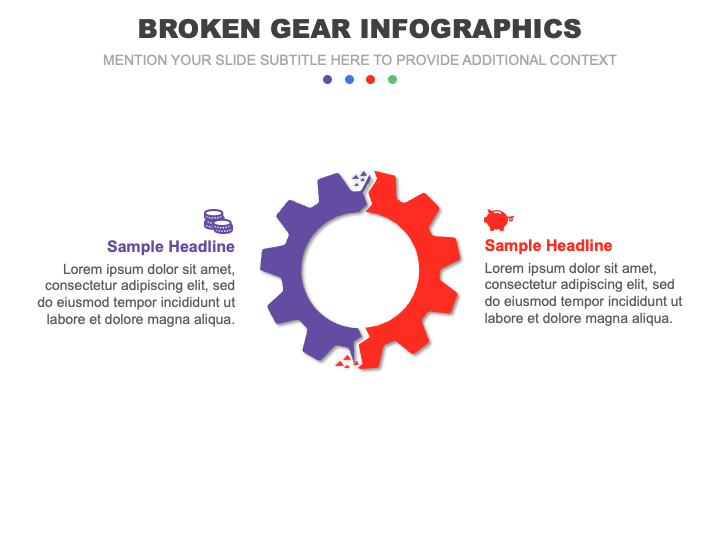
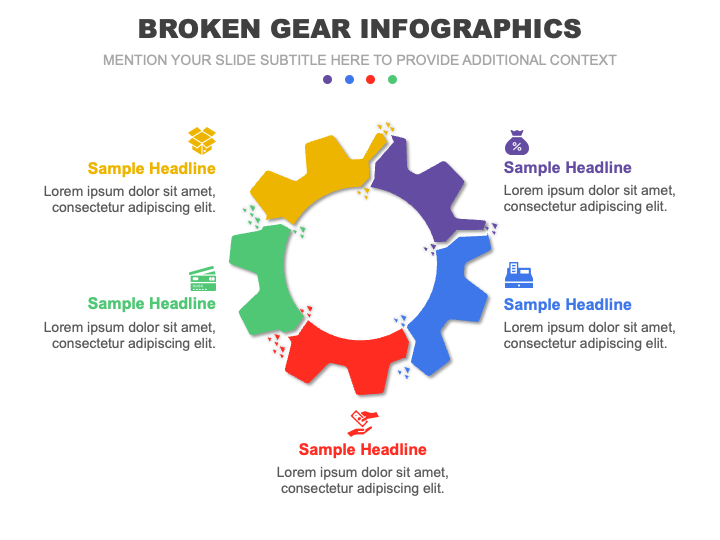
Download our Broken Gear Infographics for PowerPoint and Google Slides to represent your complex information in a visually appealing and easy-to-comprehend manner. Business professionals can use these illustrations in their presentations to display breakdowns or inefficiencies in business processes, supply chains, workplace communication, workflows, etc. Project managers can represent project bottlenecks or delays in the project management process. Risk managers can illustrate the areas of organizational processes or systems vulnerable to failure. IT professionals and software developers can depict common technical issues, system failures, or bugs in software or hardware. Additionally, you can highlight customers’ pain points, product defects, manufacturing failures, medical errors, and more.
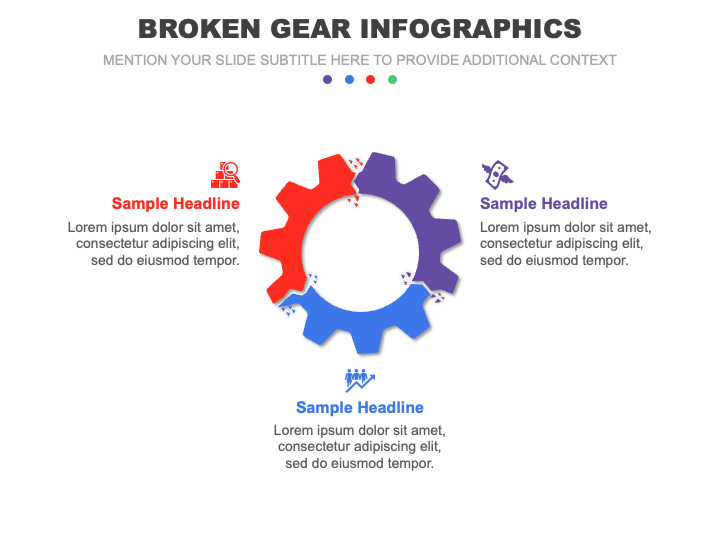
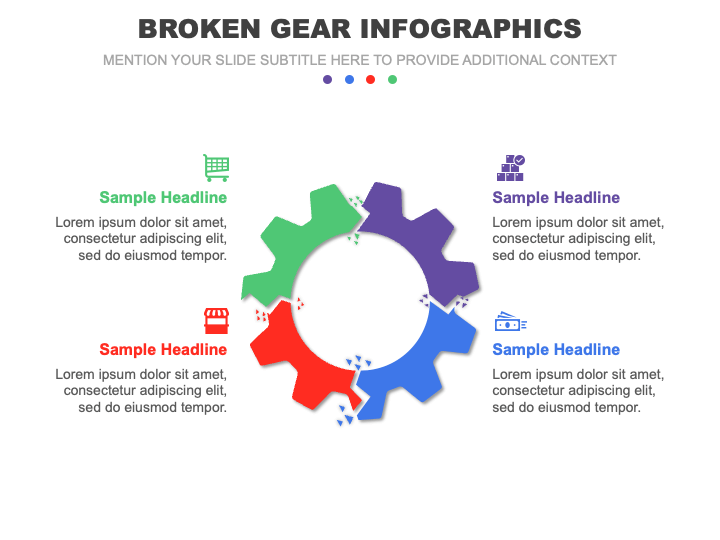
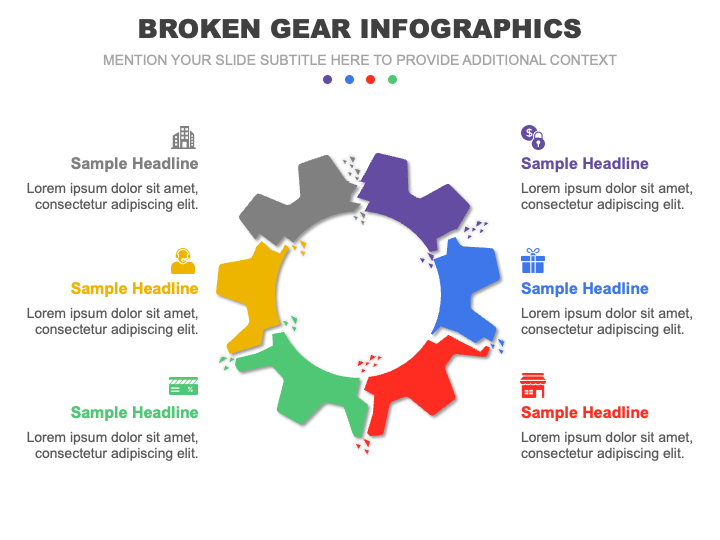
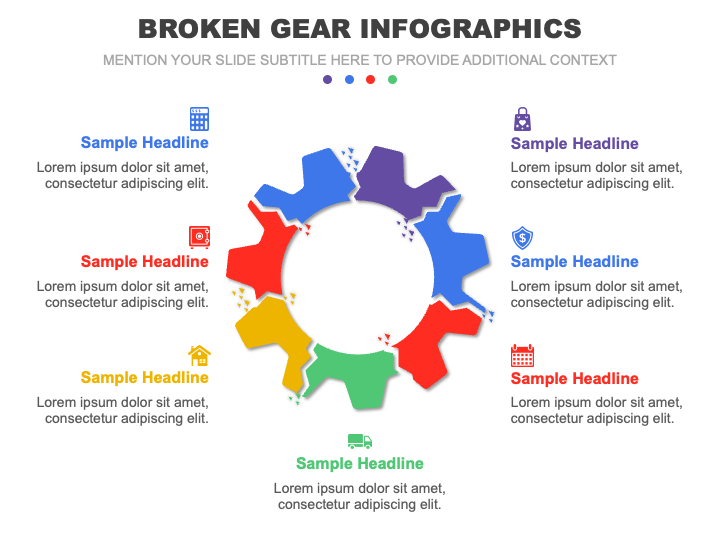
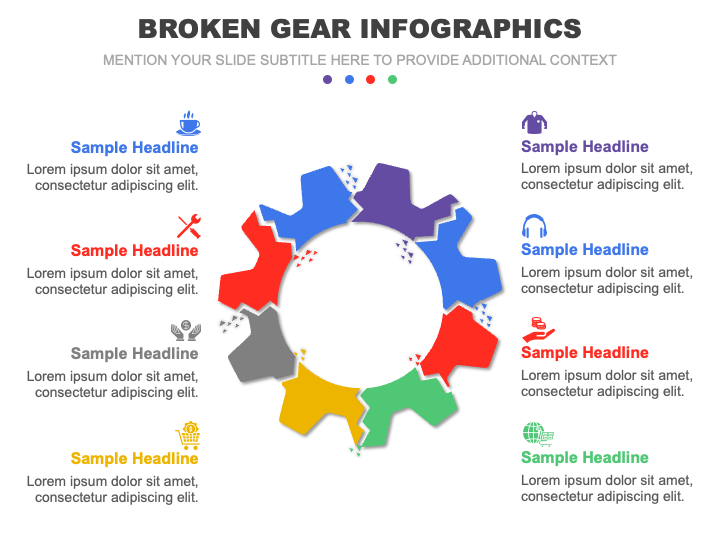
The slides comprise infographics of multi-step cogwheels with cracks adorned with compelling icons and vibrant color contrast. Each visual is accompanied by editable textual boxes, enabling presenters to insert their content.
Features
- No user requires exceptional technical expertise or external assistance to customize the graphics.
- You can project high-quality graphics on any screen without compromising the original quality or resolution.
- Everything has been carefully designed to ensure no user experiences copyright infringement issues.
Grab this template to deliver a spellbinding presentation!
Write Your Own Review

Related Products

