
Bucket Infographics for PowerPoint and Google Slides
(8 Editable Slides)

Bucket Infographics for PowerPoint and Google Slides

SB16753
Available For


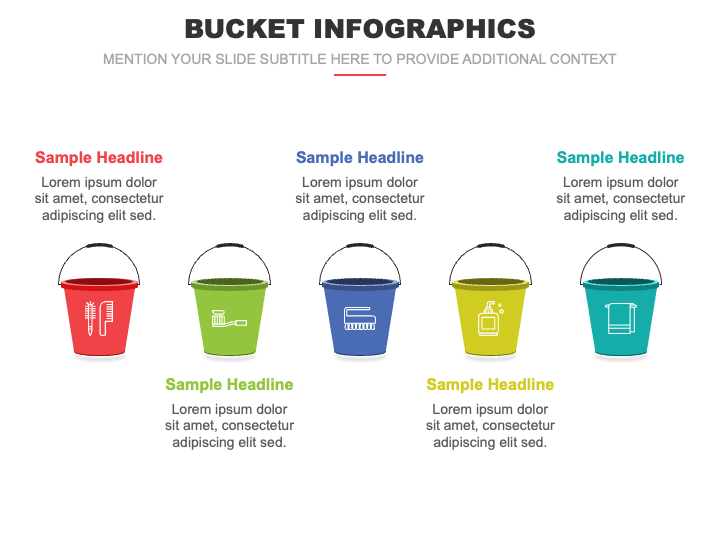
Leverage our Bucket Infographics for PowerPoint and Google Slides to portray information in an organized manner and make your presentations lively. Senior executives and finance managers can use these graphics to display budget allocation across different departments or projects. Business development professionals can use these illustrations to present the characteristics, USPs, and benefits of their wide range of offerings. Sales professionals can display sales performance metrics, such as revenue by product category, sales by region, or customer segmentation.
Waste management experts can showcase the importance of segregating waste into different categories for proper disposal and avoiding adverse impacts. Janitorial service providers can highlight their cleaning packages for various corporate and commercial settings. Environmentalists and government agencies can portray tips for saving water. Psychologists can use these illustrations to explain how colors influence the moods and emotions of people. Investment experts can describe the importance of investing in different schemes to minimize overall risk and maximize ROI. Leveraging these slides, you can show the to-do list, things to remember/consider, meeting agenda, etc., in a stylish manner.
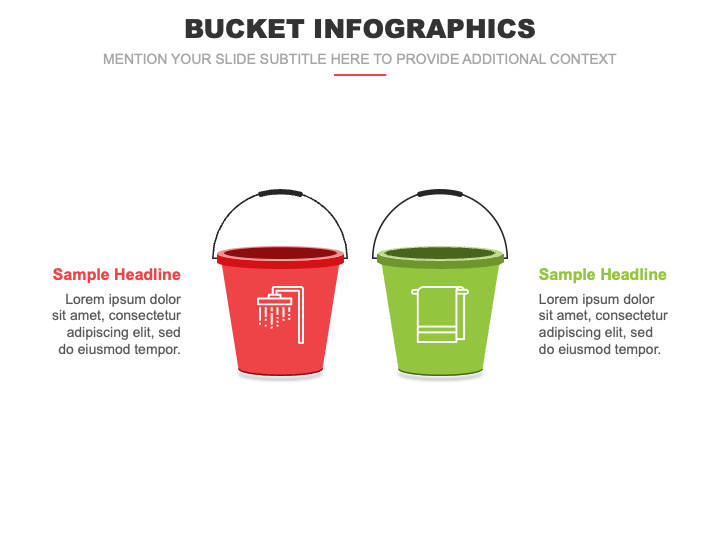
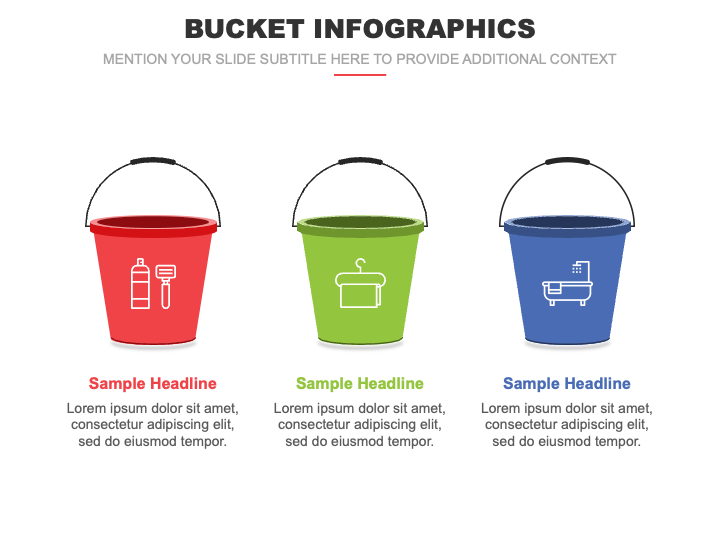
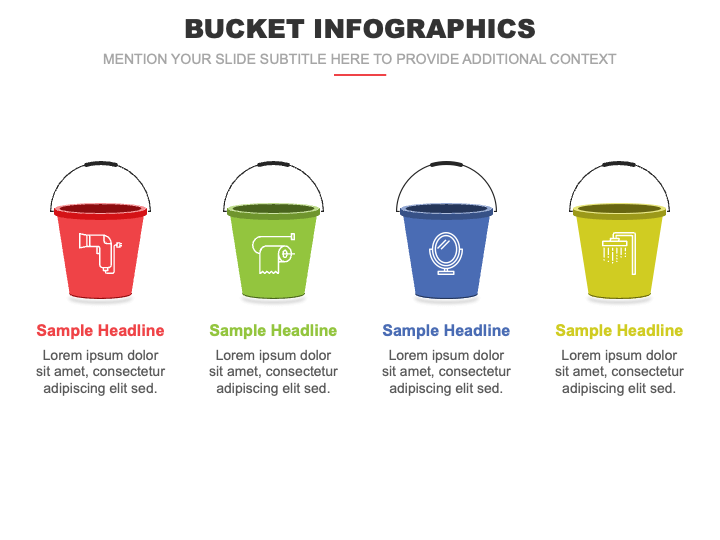
The slides comprise colorful bucket infographics adorned with self-explanatory icons. Editable textual boxes are provided to help you insert your content.
Features
- You can customize the deck components to suit your preferences without confronting challenges.
- The graphics can be scaled to any extent without compromising original quality.
- All attributes are carefully designed to ensure no user experiences copyright issues.
Grab this versatile PPT now!
Write Your Own Review

Related Products


