
Climate Change Infographics for PowerPoint and Google Slides
(10 Editable Slides)

Climate Change Infographics for PowerPoint and Google Slides

SB16739
Available For


Our Climate Change Infographics for PowerPoint and Google Slides are ideal for presenting your voluminous information in a condensed, organized, and easily readable manner. CSR managers and senior executives can use these illustrations in their presentations to showcase their company’s sustainability initiatives and progress toward going green to reduce the impact of climate change. Researchers can use this graphic-rich deck to portray climate change statistics and trends, the breakdown of greenhouse gas emissions by sector, etc. Educators can capitalize on high-quality visuals to illustrate climate change’s leading causes and consequences. Environmentalists can showcase how climate change affects biodiversity, ecosystems, and wildlife. NGOs and social advocates can highlight policy change recommendations to reduce emissions. You can also present the efforts required at the individual level to make a significant impact.
A Glance at the Slides’ Design
- You can start your presentation well with our cover slide.
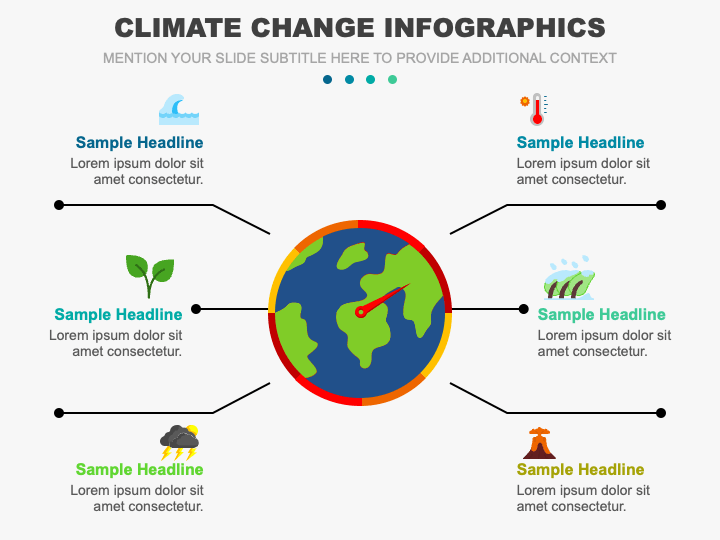
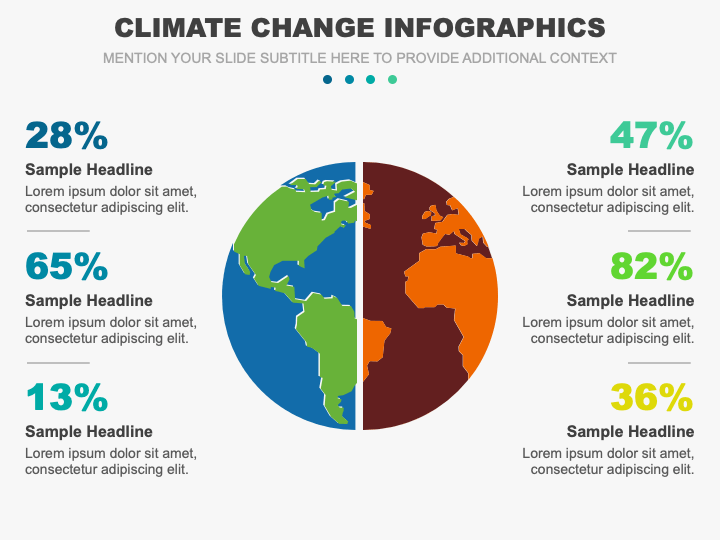
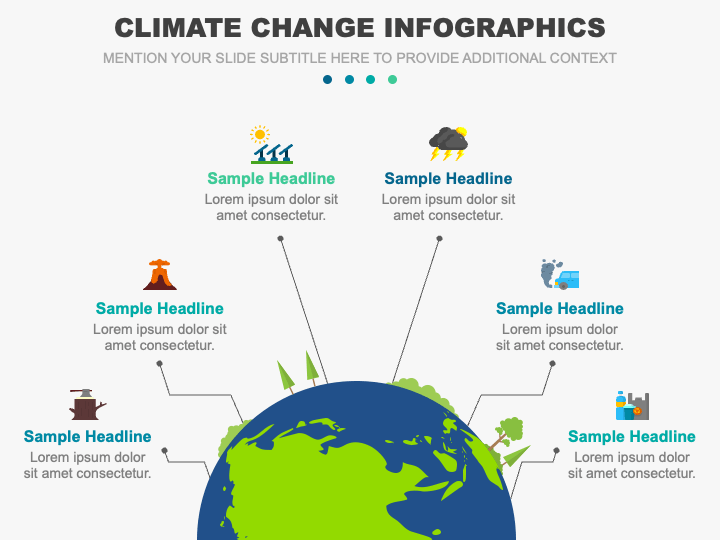
- An infographic of the planet Earth can be used to illustrate climate change’s impact across different contexts.
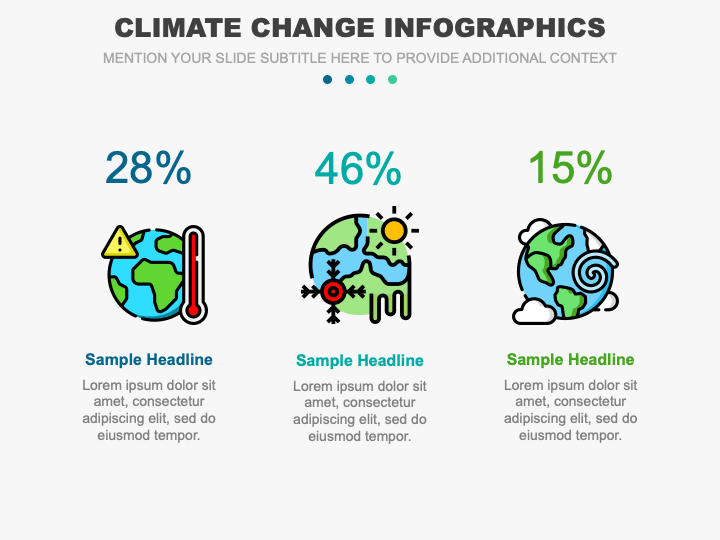
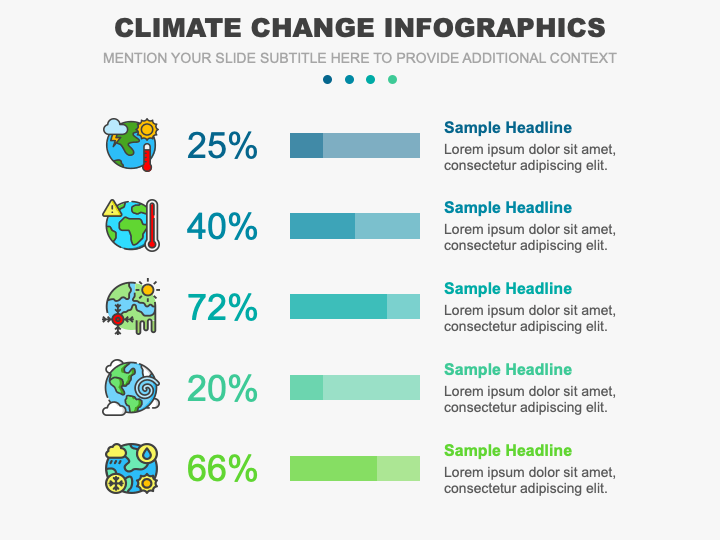
- You can depict the percentage increase in global temperature, carbon dioxide levels, sea levels, and more since the late 19th century via an illustration of globes with percentage signs.
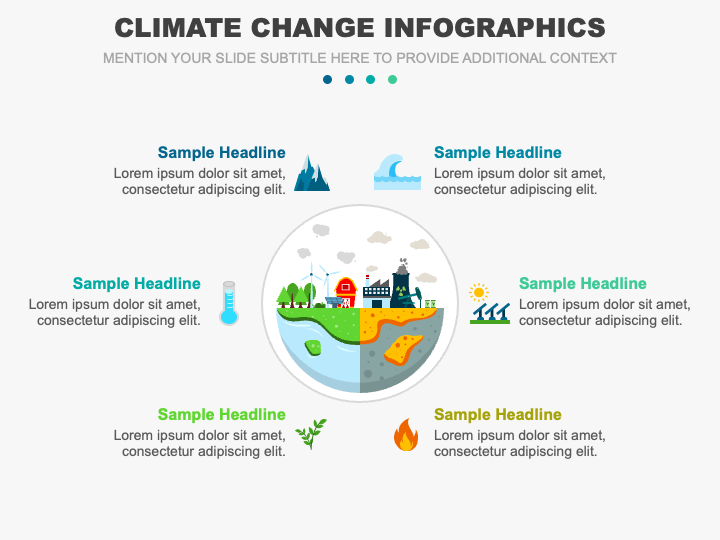
- You can depict the impact of human activities on weather patterns and their role in contributing to climate change.
- The contribution rate of multiple activities and sectors to climate change can be presented with clarity.
- The potential measures to address climate change can be shown with an illustration depicting trees, windmills, and other self-explanatory icons.
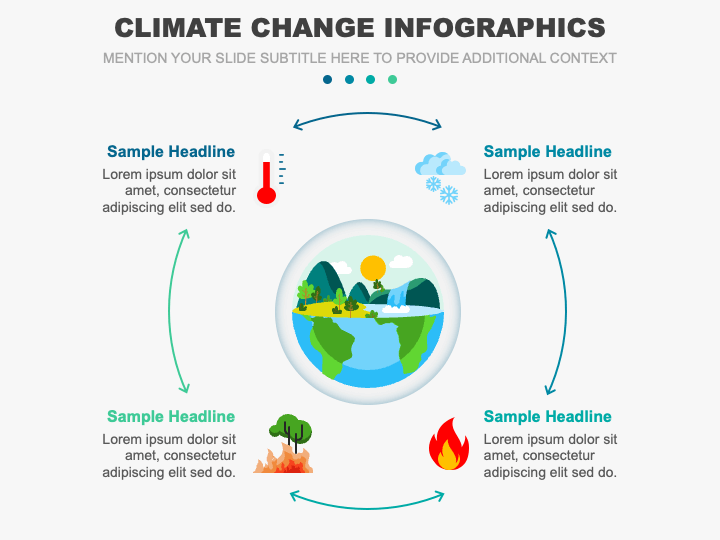
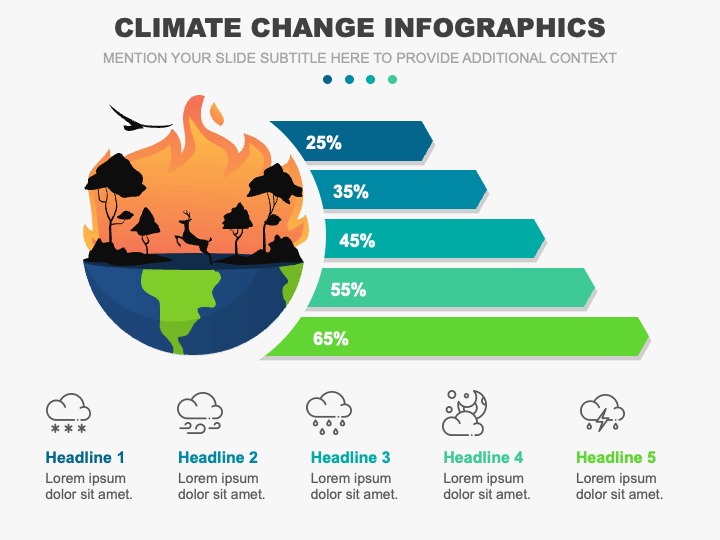
- The impact of climate change on various aspects of biodiversity and ecosystems can be illustrated through an infographic of a burning planet.
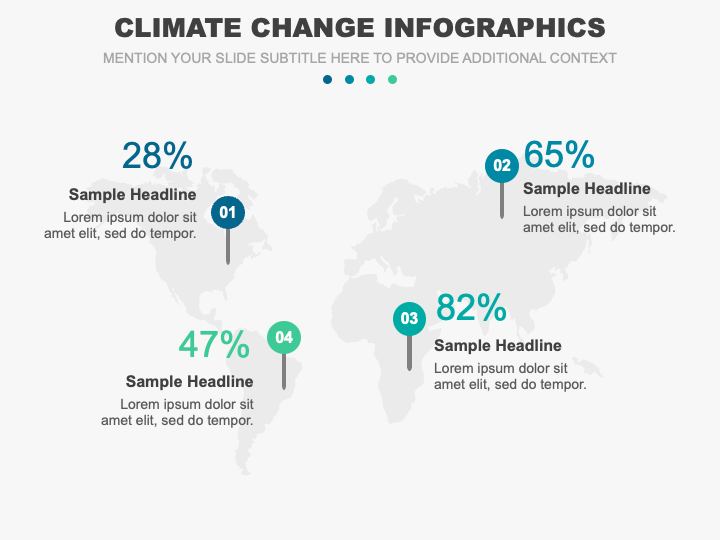
- A world map diagram can be used to depict climate change patterns in different countries.
- Portray the percentage of increase in the frequency and intensity of extreme weather events, reductions in sea ice thickness, decline in the marine species, and more using an illustration of planets with bar graphs and percentage signs.
- The global efforts to limit global warming can be portrayed clearly and precisely.
Features
- User-friendly editing enables users to make the desired changes without restrictions.
- All graphics have been designed in high-definition to ensure seamless and uninterrupted resolution and quality on all screen dimensions.
- Our experienced designers have carefully designed the set to eliminate the room for issues related to copyright violations.
Grab this feature-rich PPT today!
Write Your Own Review

Related Products


