The Indian economy is one of the top largest and fastest-growing economies in the world. We have introduced the Economy of India Theme for Microsoft PowerPoint and Google Slides to help you showcase a brief overview of the Indian economy’s growth trajectory over the last few decades. The slides feature compelling visuals of graphs, charts, shapes, and more in striking color contrasts. Using this deck, economists can depict the comparative overview of India’s growth trends with other industrially developed economies across sectors. Educators can also use this set to explain the features of the Indian economy, factors influencing a country’s economic conditions, the major sources of a country’s revenues, and much more to students.
These stunning pre-designed illustrations save you time and let you focus on connecting with your audience. Grab them now!
Captivating Slides at a Glance
- A colorful semi-arc illustration showcases the history of the Indian economy.
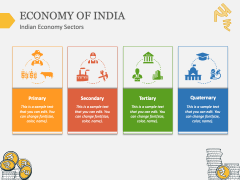
- You can exhibit the Indian economy sectors through one of the slides.
- The income and consumption of the country's economy are portrayed via an exquisite slide design.
- The Indian economy's strengths are illustrated through a creatively designed infographic.
- The major concerns of the Indian economy are highlighted via a downwards-facing arrow illustration.
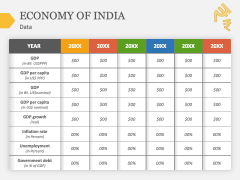
- A tabular infographic represents the growth trends and GDP over the years.
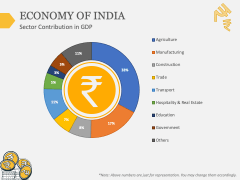
- Using a pie-chart illustration, you can demonstrate the contribution of various economic sectors to GDP.
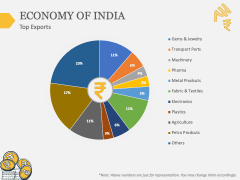
- The top exports are showcased through a pie chart diagram.
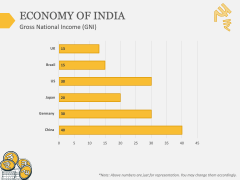
- The GNI (gross national income) is highlighted via a bar chart infographic.
Salient Features
- You can modify the deck elements without comprehensive technical skills or external aid.
- The set attributes are designed after thorough research, leaving no room for copyright issues.
- All graphics can be visualized to any extent without hampering the optical resolution.
Download this spellbinding template design and deliver picture-perfect presentations!

