
Environment Infographics for PowerPoint and Google Slides
(10 Editable Slides)

Environment Infographics for PowerPoint and Google Slides

SB16717
Available For


Grab our Environment Infographics for PowerPoint and Google Slides to convey your message more persuasively and help your audience retain the key takeaways for longer. CSR managers can use this deck to display their company’s sustainability initiatives, achievements, and progress toward carbon neutrality and social responsibility.
Environmentalists and researchers can leverage this template in their presentations to highlight the environmental impact of various activities, such as transportation, energy sources, industrial practices, etc. Waste management experts can capitalize on these multipurpose infographics to illustrate the best practices for proper waste disposal and the importance of recycling and reducing single-use plastics. Ecologists can use these visuals to portray the benefits of shifting to renewable energy sources. NGOs and social advocates can depict the recommendations for conservation efforts to reduce the impact on biodiversity and preserve endangered species. Agricultural engineers and scientists can foster an understanding among farmers about sustainable farming practices and their benefits.
A Glance at the Slides’ Design
- A beautiful cover slide is provided to help you kickstart your presentation impressively.
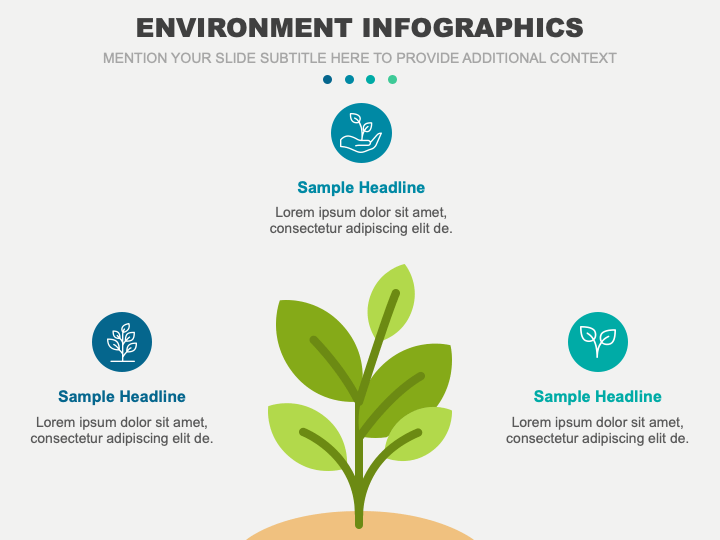
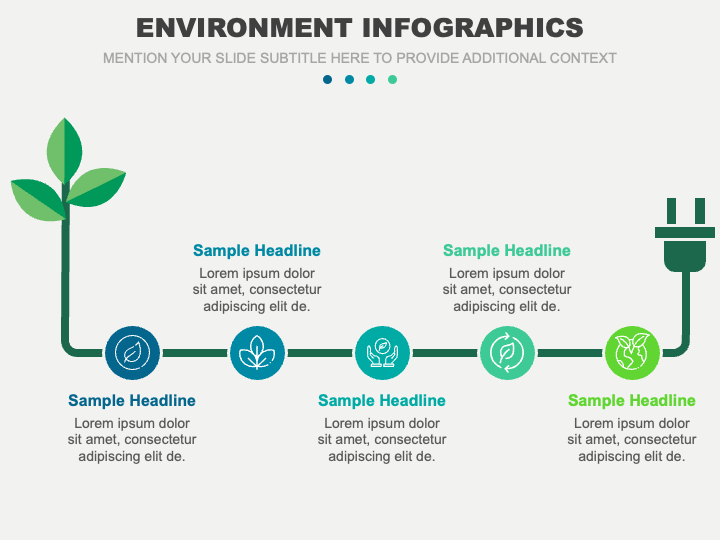
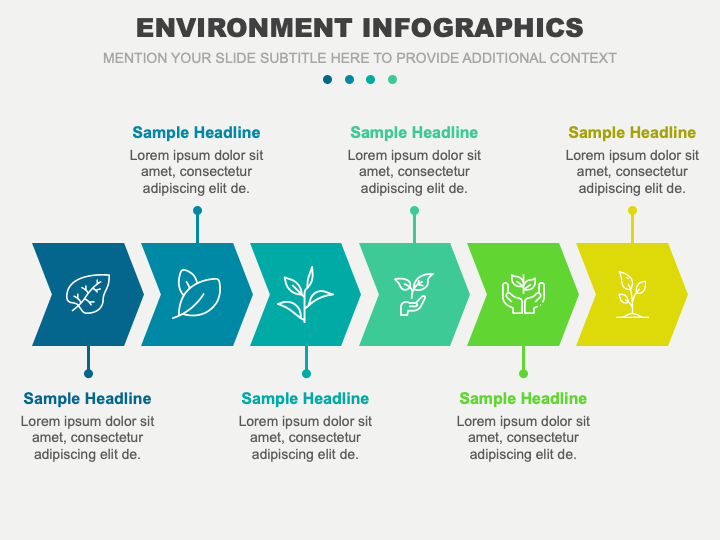
- An infographic of a plant can be used to highlight the benefits of planting trees.
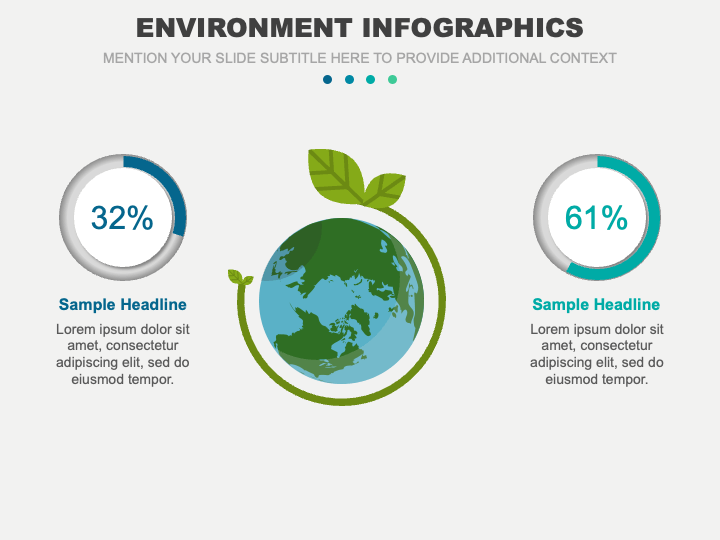
- An illustration of a globe with donut charts can be used to showcase the global distribution of renewable energy usage.
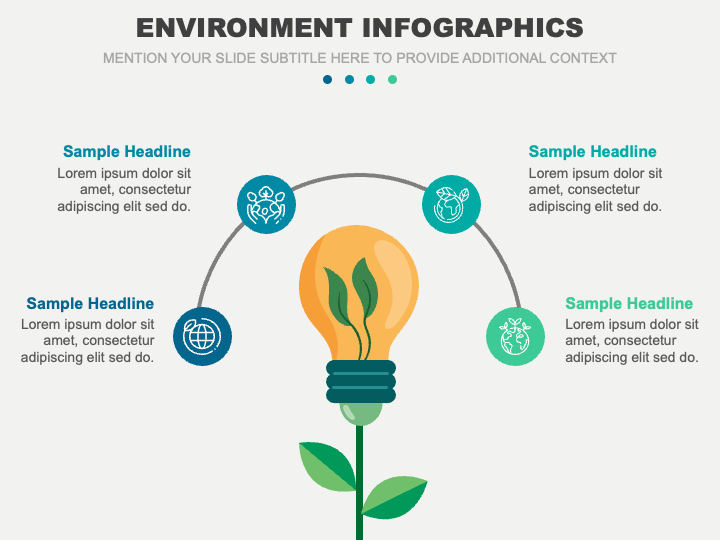
- A light bulb diagram can be used to illustrate the sources of clean energy.
- Demonstrate how technology can be environmentally friendly and sustainable via an eye-pleasing illustration.
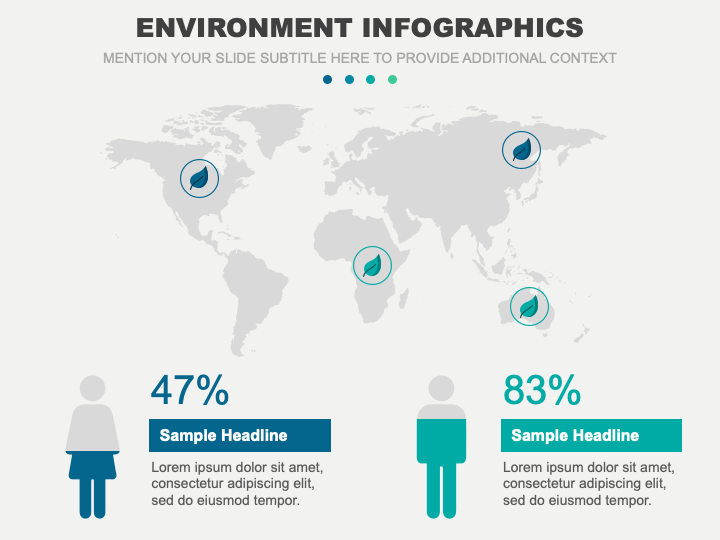
- Use a map diagram to highlight the environmental impact of different regions worldwide.
- You can exhibit the innovations and strategies for minimizing environmental impact in various industries.
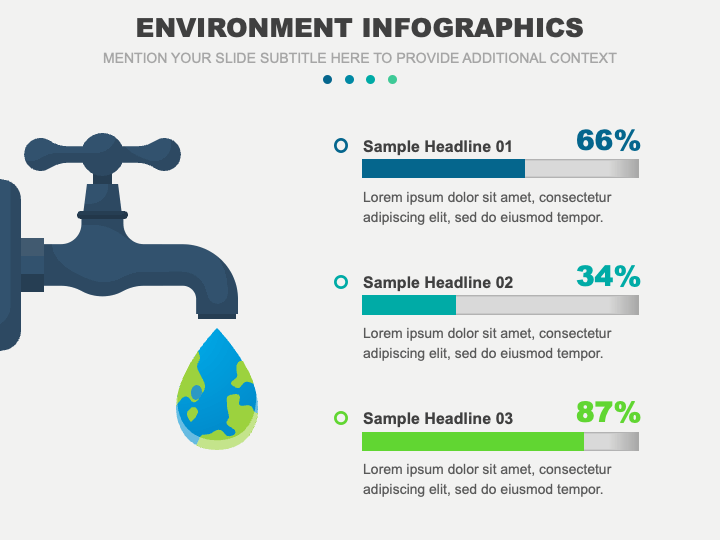
- Present water pollution levels in different regions via an illustration of a tap.
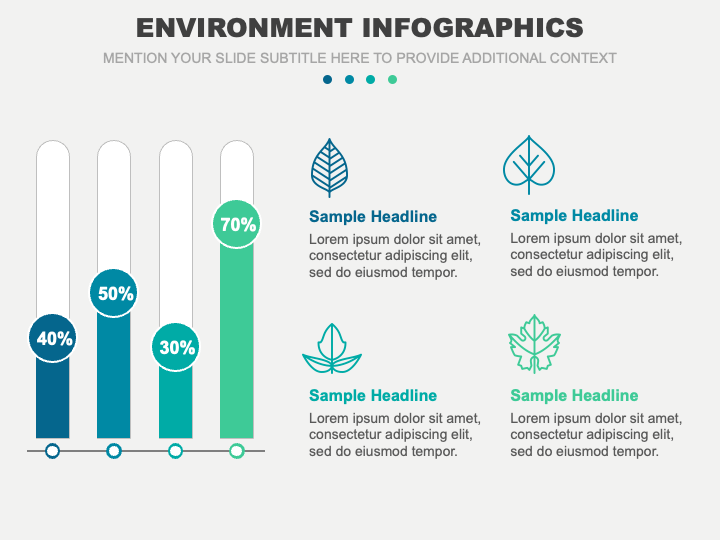
- Use the infographic of a bar graph to display the contribution of various sectors to the overall greenhouse gas emissions, air quality index of different locations, and more.
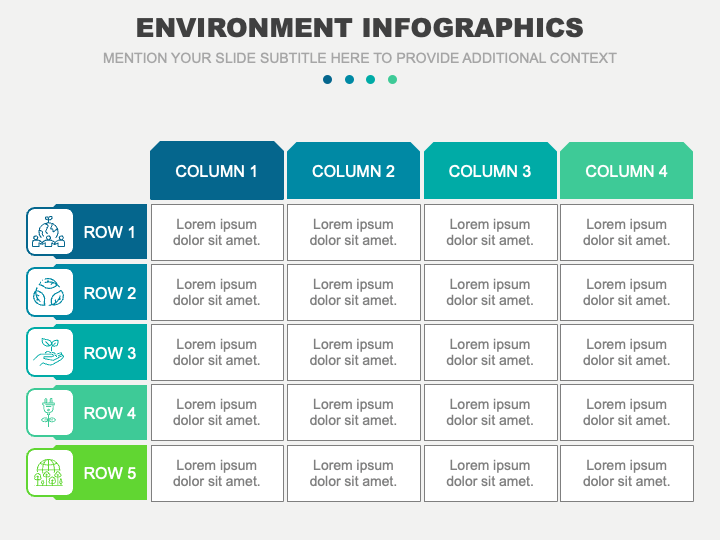
- A tabular infographic can be used to depict the strategies for tackling challenges posed by deforestation, urbanization, climate change, and more.
Features
- Easy-to-edit
- High-resolution graphics
- Copyright-free
- 24/7 customer support
Download this PPT without any second thought!
Write Your Own Review

Related Products


