Financial Analysis PowerPoint and Google Slides Template
(6 Editable Slides)
Financial Analysis PowerPoint and Google Slides Template
Available For
Explain the process of evaluating a company’s performance and its current and future financial health with our Financial Analysis PowerPoint template. Financial analysts can use this fully editable deck to discuss how this analysis helps business managers make decisions and helps investors figure out the best investment opportunities. Entrepreneurs and C-Suite executives can use this set to provide critical insights into how this analysis helps evaluate economic trends, identify the best avenues of investment for the company, and set an organization’s financial policy.
Our Financial Analysis PPT provides you beautifully structured slides powered with stunning infographics and illustrations, designed in striking color combinations and shades. Our proficient designers have taken due care of innovation, the latest design trends, and other requirements to help you present with excellence. So, download this deck now to make your information more meaningful.
What is Included in the PPT?
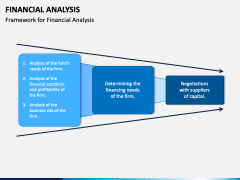
- A diagram presents the framework in an easy-to-understand manner.
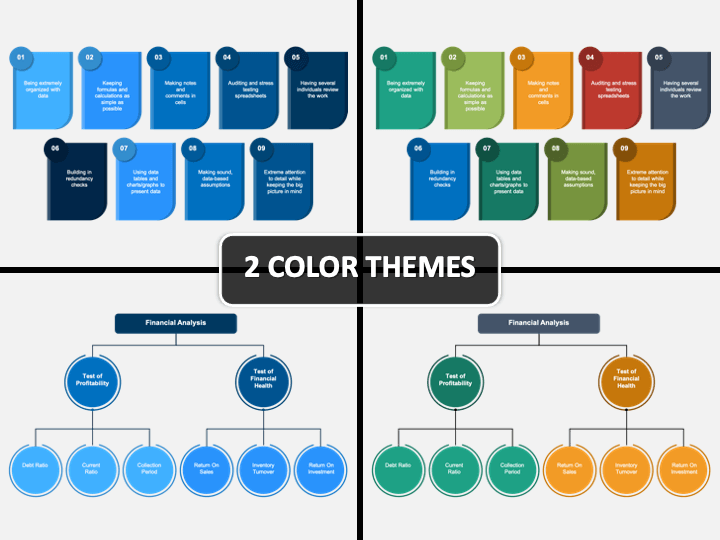
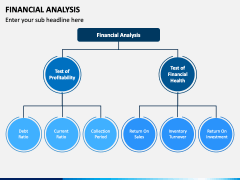
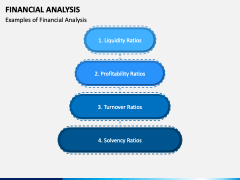
- A beautifully-designed illustration depicts the different ratios calculated during this analysis for testing the profitability and financial health of an enterprise.
- Examples of four different ratios analyzed during this process, i.e., Liquidity, Profitability, Turnover, and Solvency, have been provided clearly and concisely.
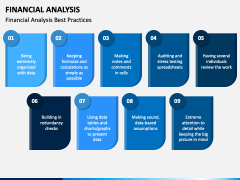
- An infographic illustrates the best practices in a comprehensible manner.
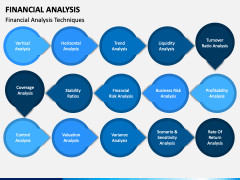
- An infographic with distinctly shaded circles presents the techniques of analyzing financial performance.
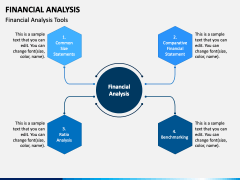
- An eye-catching illustration demonstrates various tools, i.e., Common Size Statements, Comparative Financial Statement, Ratio Analysis, and Benchmarking.
About the Features
- You can comfortably scale the graphics, resize the icons, change the background theme, and make other edits without any comprehensive editing skills or external aid.
- It is easy to copy any diagram or infographic from this set and paste it into your in-progress and future presentations.
- Every object of the template is designed from scratch to avoid copyright infringement issues.
- High-definition graphics have been incorporated to ensure excellent optical quality and resolution.
- It is reusable for a lifetime.
Intrigue your audience with trendy, high-quality design slides. Download the set now!

