
Gartner Magic Quadrant PowerPoint and Google Slides Template
(5 Editable Slides)


Gartner Magic Quadrant PowerPoint and Google Slides Template

SB899
Available For


Similar Products
- Sale

-
-


Define a qualitative introspection of your business and monitor the progress of your brand with our Gartner Magic Quadrant PowerPoint template. Gartner, the acclaimed US academician and market researcher came up with a magic quadrant report that acts as a successful tool to compare business details, quantify any company's progress, its gain and possible functionality.
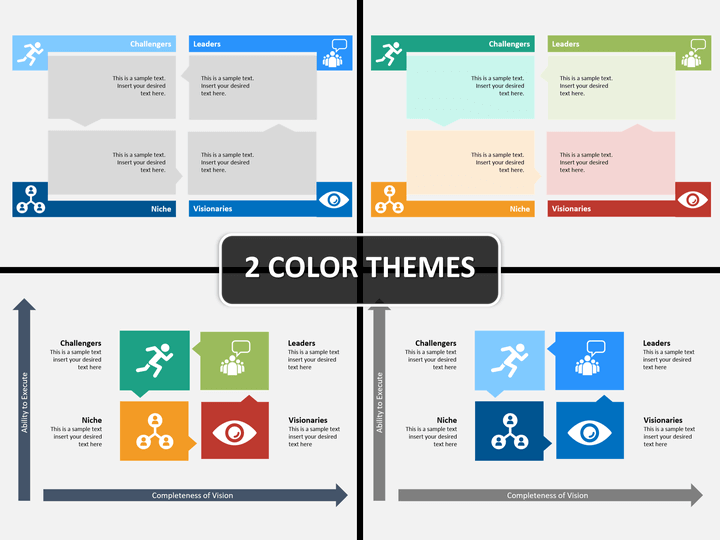
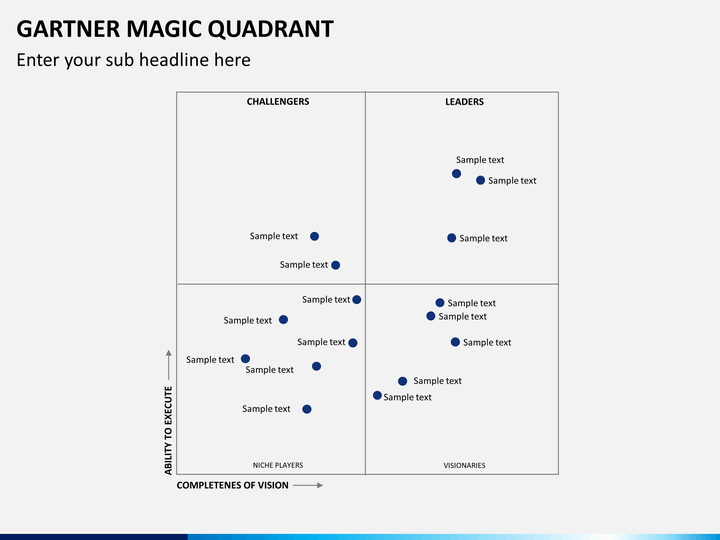
According to Gartner, simple depiction of statistics or a company's ranking on the basis of different indicators is not enough to successfully quantify a business's growth. It uses a two-dimensional illustration that represents the business of any company in four different sections.
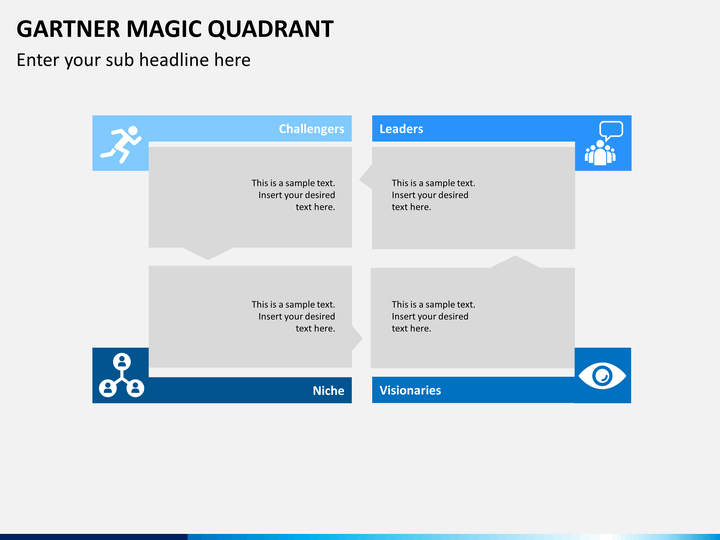
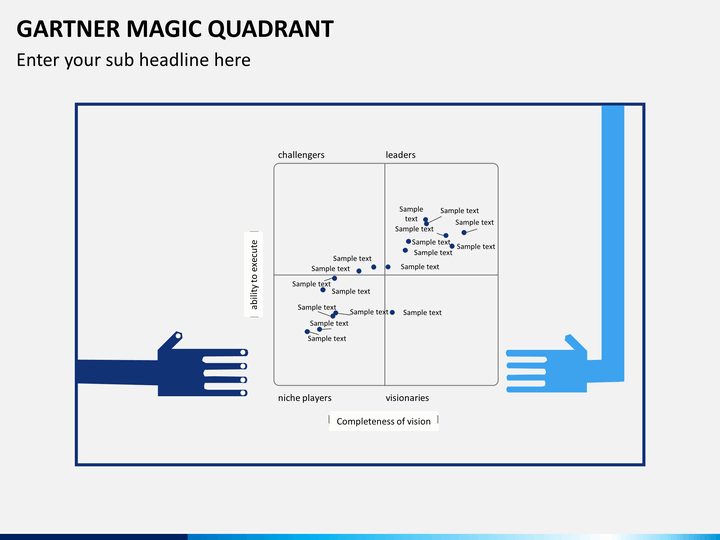
The template set consists of 5 editable PPT slides that represent the four significant indicators of the quadrant in various forms. It consists of four sections that were derived from two major criteria - the ability to execute and completeness of vision. The four sections consist of Leaders, Visionaries, Niche Players, and Challengers. All these sections are represented in different ways in this presentation with the help of high definition graphics and informative illustrations. All the above four quadrants are placed on the basis of the two significant criteria. Leaders are given the highest priority and are scored higher on both the criteria, which implies to a larger and more mature business. Challengers are scored higher on the basis of ability to execute, but lower on the completeness of visions, which represents the established businesses that have limited future plans. Visionaries have a lesser score on the ability to execute, but more on the completeness of vision and depict smaller industries. The remaining, Niche players score low on both the criteria and are supposed to be the new players. On the basis of these derivatives, a business can be scored in any of the sections.
If you work for an investment firm, then this well-researched set can help your compare business details of any company; let you quantify progress, its gain, and possible functionality. It is a highly useful presentation for every business analyst, founder or partner, who would like to present an idea of their company's growth to fellow investors or prospective buyers, as the set can let them compare the true gain and progress of any business.
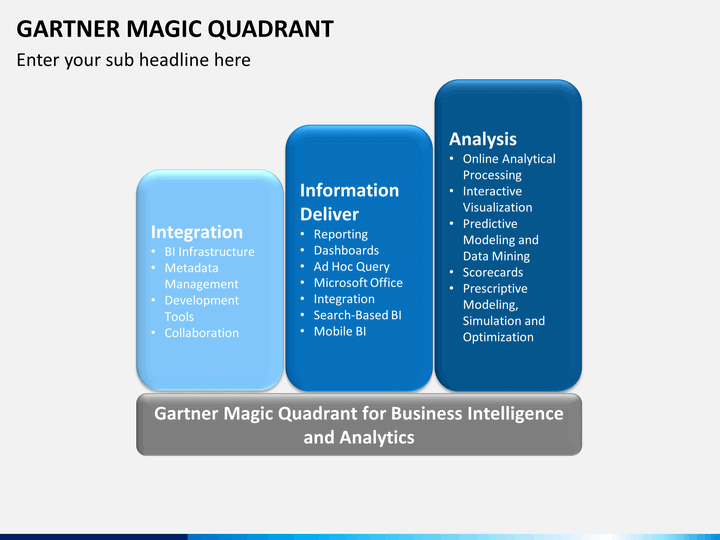
An additional Gartner magic quadrant for business intelligence and analysis has been added in the presentation that can help one explore the model of business intelligence on the basis of integration, information delivery, and analysis. Create a professional impression and explore the remarkable idea with this highly informative and easy to execute set.
Write Your Own Review

Related Products


