Healthcare Infographics for PowerPoint and Google Slides
(11 Editable Slides)
Healthcare Infographics for PowerPoint and Google Slides
Available For
Grab our Healthcare Infographics for PowerPoint and Google Slides to illustrate a range of information, stats, and concepts related to healthcare in a visually appealing and easy-to-understand manner. Healthcare professionals can use these versatile illustrations to display statistics on diseases like diabetes, hypertension, and cancer. Hospital administrators can illustrate the services and facilities of their hospitals. Caregivers can educate patients and their family members about medical conditions, treatment plans, and preventive measures. Medical researchers and companies can visualize advancements in medical technology, such as telemedicine, wearable health trackers, robotic surgery, etc.
Advocacy groups and NGOs can highlight global health challenges like infectious diseases, maternal mortality, access to healthcare, etc. Policymakers and healthcare analysts can use these versatile illustrations to portray healthcare policies, reforms, or legislative changes at local, national, or international levels.
A Quick Look at the Slides’ Overview
- An infographic of a stethoscope can be used to illustrate clinical trials, healthcare workflows, patient journeys, etc.
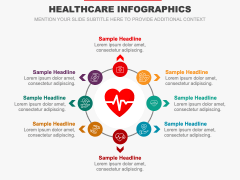
- You can showcase the heart anatomy, diseases, risk factors, and more through an illustration of a circular infographic with a heart in the center.
- The key components of the lungs, respiratory function, and diseases and treatments related to the respiratory system can be shown precisely.
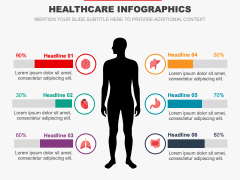
- An illustration of a male silhouette with icons of different organs and percentage signs can be used to showcase facts about the male body.
- The characteristics of DNA can be showcased with an eye-pleasing infographic.
- With an illustration of a male and a female body silhouette, you can exhibit the comparison of males and females based on physiological, psychological, and social factors.
- The best practices for improving and maintaining good heart health can be presented via an infographic of a doctor’s case.
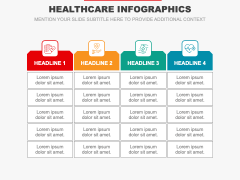
- Showcase the range of healthcare services offered in a hospital through a tabular graphic.
- A circular illustration divided into four parts can be used to present the factors responsible for increasing the chances of specific diseases.
Features
- Modifying these illustrations to suit your preferences is an effortless task.
- High-quality infographics can be projected on any screen without optical resolution loss.
- Our experienced designers have thoughtfully designed each attribute to leave no room for issues related to copyright violations.
Download this PPT right away!

