Horizontal Pipeline Infographics for PowerPoint and Google Slides
(7 Editable Slides)
Horizontal Pipeline Infographics for PowerPoint and Google Slides
Available For
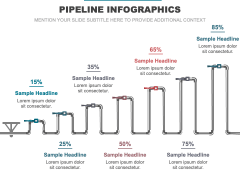
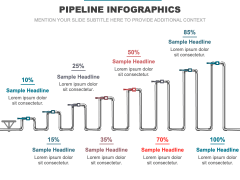
Grab our Horizontal Pipeline Infographics for PowerPoint and Google Slides to showcase stages or phases of a process and their completion percentages. Project managers can use this graphic-rich template to visualize the project’s progress, helping stakeholders track milestones. Sales and marketing professionals can showcase the stages of the sales funnel with conversion rates at each stage, highlighting the effectiveness of the process and areas for improvement. Product managers can highlight the progress of product development across the lifecycle phases.
HR professionals can use these versatile graphics to illustrate the status of job applications in the recruitment pipeline. Industrial trainers can use these visuals to demonstrate the completion percentage of various modules of a training program. Additionally, these multipurpose illustrations come in handy to showcase the progress or status of various tasks or processes, facilitating informed decision-making.
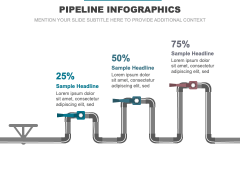
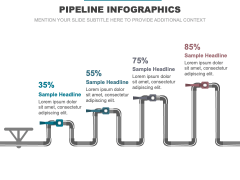
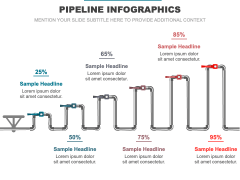
The slides feature various zigzag pipeline infographics with percentage signs. The editable textual boxes make the illustrations reusable.
Features
- Customizing the infographics to suit your preferences is absolutely hassle-free.
- Our experienced designers have performed in-depth research to design each illustration, ensuring no room for copyright issues.
- The high-quality infographics render the same quality, even when scaled to a widescreen.
Download this PPT to make your presentations shine!

