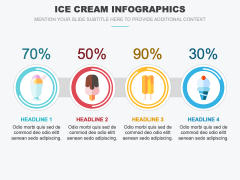
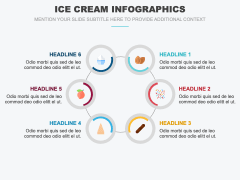
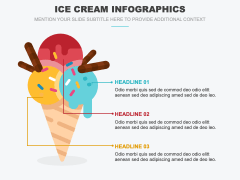
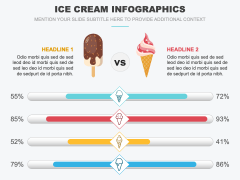
Download our Ice Cream Infographics for PowerPoint and Google Slides to showcase various interesting facts and statistics about ice cream with clarity and persuasion. Market researchers can use these high-definition graphics to showcase ice cream consumption changes over the years, highlighting market trends and opportunities. Sales professionals can highlight promotional and sales tactics to increase the demand for ice cream, attract customers, and drive more sales and revenue.
Food industry professionals and marketers can display popular ice cream flavors across different regions. Ice cream manufacturers and nutritionists can use these eye-pleasing illustrations to depict the nutritional content of various ice cream types. Culinary experts can also use these visuals in their presentations to visualize the step-by-step process of making ice cream at home.
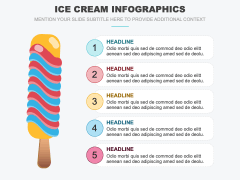
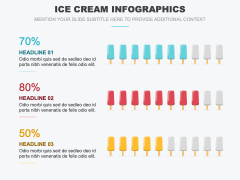
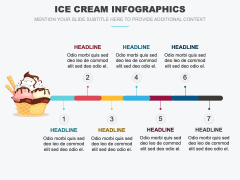
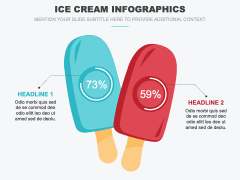
The slides feature compelling illustrations of donut charts, ice cream cones, percentage signs, and more. The visuals are adorned with a vibrant color scheme and stunning icons to help users elevate their content and improve overall comprehension.
Features
- Easy customization
- High-definition graphics
- Copyright-safe
- 24/7 customer support
Get this PPT now!

