International Day for Older Persons Presentation - Free Download
(17 Editable Slides)
International Day for Older Persons Presentation - Free Download
Available For
Every October 1st marks the International Day for Older Persons. The day aims to increase understanding of older people’s problems, celebrate their contributions to society, and promote their lifelong health and dignity. Various organizations, communities, and governments worldwide hold events and activities to encourage the general public to create supportive environments for the elderly population. It also serves as an opportunity to advocate for the rights of older persons for clean living environments, food, safety, security, healthcare facilities, and more. Every year, this day is observed with a unique theme, focusing on older people’s rights, efforts to improve their lives, etc.
Download our International Day for Older Persons template for PowerPoint and Google Slides to showcase more details about this day. With a serene backdrop, multicolor graphics, stunning icons, and eye-pleasing design elements, these slides give your information a structured look, improving readability and comprehension.
Let’s Look at the Slides
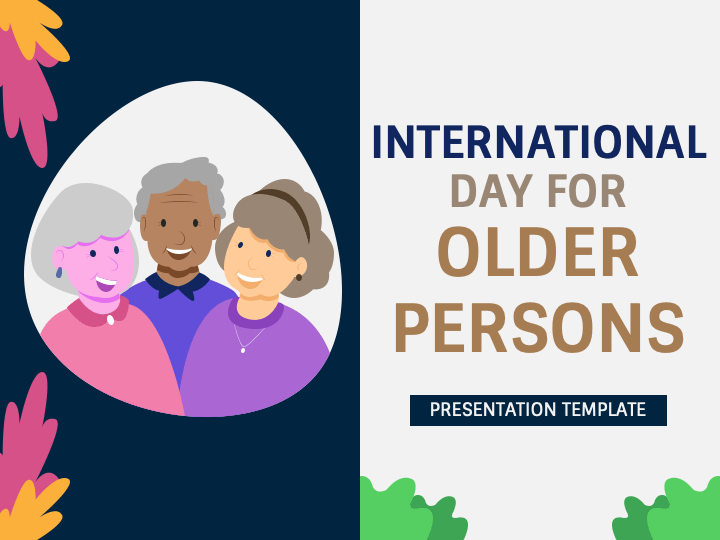
- You can elevate the beginning of your presentation with our striking cover slide.
- Present your presentation’s agenda through a Table of Contents slide.
- Showcase an introduction to your topic through a compelling illustration.
- Use multi-step infographics to highlight the contributions of older people to society, tips for maintaining physical and mental well-being in old age, and more.
- Display how changes in societal changes and family dynamics over the years have affected older adults via a timeline infographic.
- Highlight older individuals’ characteristics, needs, and strengths using a features infographic.
- Showcase the quote regarding older adults with clarity.
- Use the stats layout to display the proportion of the global population above 60, the average life expectancy, the health conditions of older adults, and more.
- Present the various dimensions or categories related to older people via a matrix infographic.
- A bar graph can be used to depict the prevalence rates of common chronic conditions among older people.
- A map diagram can be used to showcase the accessibility of healthcare care and social support services for older adults by region.
- Thank your audience for their undivided attention and support using our ‘Thank You’ slide.
Features
- Fuss-free editing
- High-resolution graphics
- 24/7 customer support
- Copyright-free
Grab this PPT now!


