Medical Infographics for PowerPoint and Google Slides
(10 Editable Slides)
Medical Infographics for PowerPoint and Google Slides
Available For
-
-
-
-
-
-
Medical Services Company Profile PowerPoint and Google Slides Template
(15 Editable Slides)
Download our Medical Infographics for PowerPoint and Google Slides to improve your presentation’s impact and message delivery. Research analysts can use these illustrations to highlight stats about prevalent diseases, such as the number of cases, mortality rates, and affected demographics. Medical professors can use these graphics to facilitate an easy understanding among the students about the lifecycle of an illness, from risk factors and onset to treatment and recovery.
Healthcare advisors can portray a comparison of different treatment options for a specific condition. Doctors and nurses can use these illustrations to present complex medical procedures and medication information, including dosage, side effects, and usage guidelines. Nutritionists and dieticians can display preventive measures and lifestyle choices to reduce the risk of certain medical conditions. IT professionals can demonstrate cutting-edge medical technologies, equipment, or procedures and their impact and benefits. Additionally, you can portray patient journeys, medical research breakthroughs or discoveries, etc.
A Sneak Peek at the Slides’ Design
- Make your presentation’s beginning engaging via an eye-pleasing cover slide.
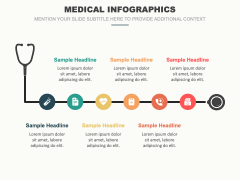
- An infographic of a stethoscope timeline can be used to depict the patient’s journey.
- You can exhibit types of medicines and their uses via an illustration of tablets, capsules, syrup bottles, a mask, etc.
- You can portray stages of a clinical trial, drug discovery, and more via an infographic of several clipboards.
- The formula of a medicine can be showcased via a colorful capsule graphic.
- Present the types of vaccines for a specific medical condition and their effectiveness via a visual of several syringes.
- The types of ambulance services can be showcased via an ambulance illustration.
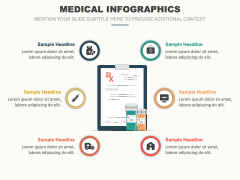
- Showcase the intricacies of a specific disease, including key facts, symptoms, treatment options, medications, and prevention methods via a clipboard illustration.
- Highlight information about blood groups, blood type matching, and more via a grid table infographic.
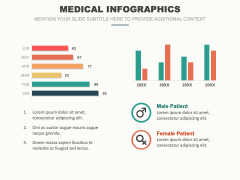
- Use the bar graphs to represent the prevalence of illness based on gender and age groups.
Features
- User-friendly editing enables users to tailor the visuals to suit their preferences without confronting restrictions.
- The original quality or resolution will remain uninterrupted, even when scaled to a larger screen.
- All attributes are designed from scratch to eliminate the room for copyright infringement issues.
Grab this PPT to infuse dynamism into your slideshows!


