Sales Infographics for PowerPoint and Google Slides
(9 Editable Slides)
Sales Infographics for PowerPoint and Google Slides
Available For
Leverage our Sales Infographics for PowerPoint and Google Slides to depict complex sales data and insights in a clear and visually appealing manner. Sales executives can use these high-definition graphics to visualize the sales objectives and process, from lead generation to conversion. With these multipurpose illustrations, you can exhibit top-selling products or services, sales trends over time, and more. Market analysts can display customer demographics and buying behavior and explain how different customer segments contribute to overall sales. These illustrations also come in handy to highlight sales data based on geographical regions, sales performance compared to competitors, and more. Moreover, you can illustrate sales projections based on current trends, return on investment for specific sales campaigns, and more.
A Glance at the Slides
- Start your presentation impressively with our cover slide.
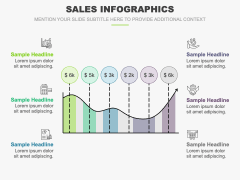
- Depict the change in sales over a specific period through a graph infographic.
- A tabular infographic can be used to present the sales targets achieved or missed by different sales executives in a specific quarter.
- A dollar currency infographic can be used to display the contribution of different business units to overall sales.
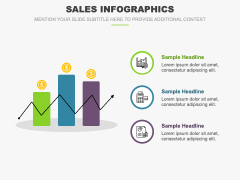
- The comparison of yearly revenue and customer satisfaction can be showcased via a bar graph infographic.
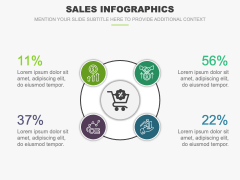
- Portray the company’s sales achievements and growth potential across different contexts through a circle diagram.
- Use a bar graph to highlight the profitability of different products.
- Several semi-circles can be used to display the probability of lead conversion at different stages of the sales process.
Features
- Easy customization lets users modify the deck components to suit their preferences.
- The high-definition graphics guarantee the same resolution and quality, even when projected on a bigger display.
- Our experienced designers have thoughtfully crafted the set to eliminate the room for copyright breach incidents.
Download this graphic-rich PPT to enhance your presentation’s visual appeal!


