
School Infographics for PowerPoint and Google Slides
(8 Editable Slides)


School Infographics for PowerPoint and Google Slides

SB16684
Available For


Similar Products
- Sale

- Free
- Free
- Free
- Free
- Free


Grab our School Infographics for PowerPoint and Google Slides to draw the audience’s focus to your slides and make it easier for them to comprehend and retain the key takeaways for longer. School administrators can use these high-definition graphics to represent their school’s demographics, performance, and achievements in the past academic year. Principals can leverage this graphic-rich deck to communicate their school’s future goals, initiatives, and planned improvements to students and their parents. Teachers can use these compelling visuals to depict insights about student performance to parents or guardians. Admission managers can also use these illustrations to portray notable awards or recognition received by the students, extracurricular activities the school conducts, the school’s infrastructure, and more.
Let’s Look at the PPT’s Overview
- A beautiful cover slide is provided to help you make your presentation’s start impactful.
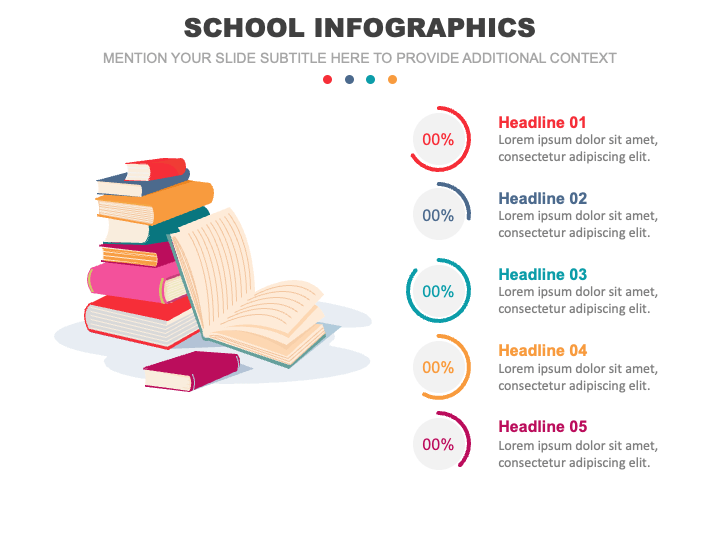
- An infographic of a book stack with percentage signs can be used to illustrate the average percentage of marks obtained by students in different subjects of a specific class.
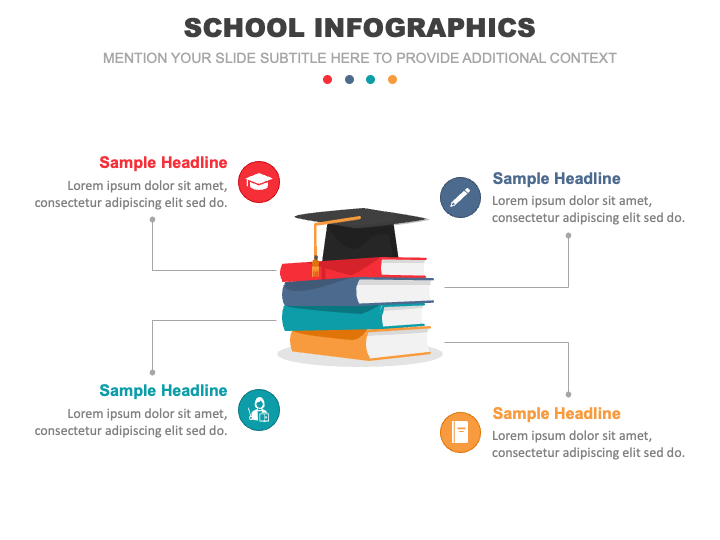
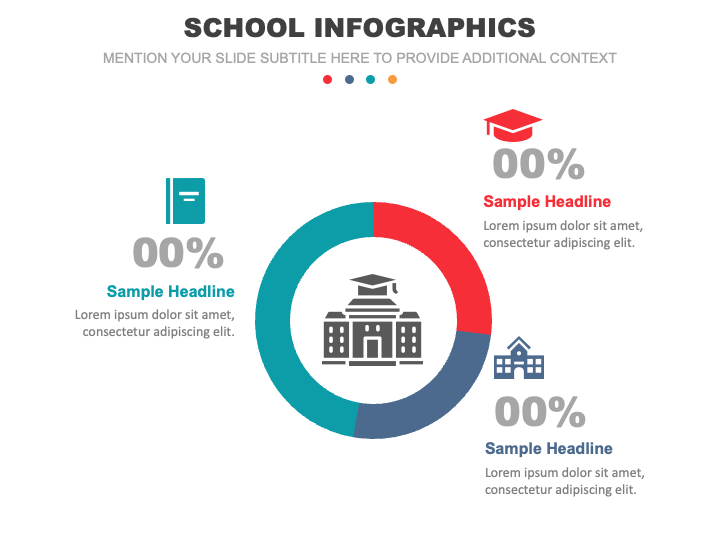
- An illustration of a book stack with a graduation cap can be used to highlight the key achievements of students across different contexts in a specific academic year.
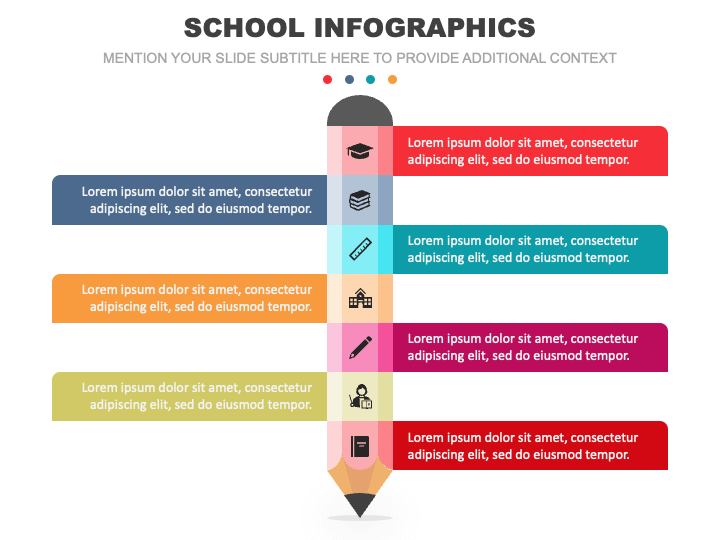
- A pencil infographic can be used to present a student’s progress, extracurricular involvement, and more.
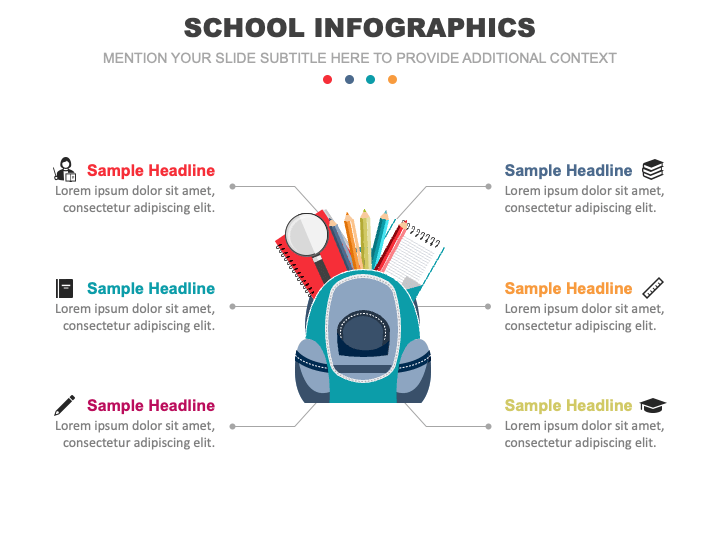
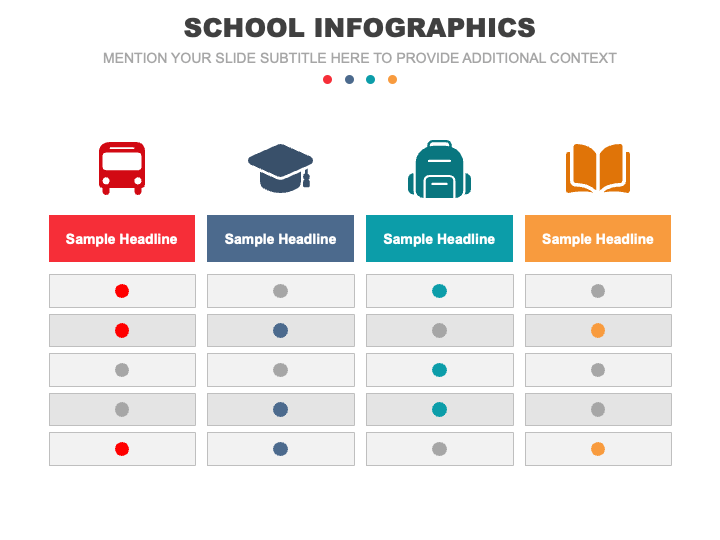
- You can exhibit the essential things that should be in every student’s bag via a backpack infographic.
- Use the donut chart to highlight the distribution of grades achieved by students of a school.
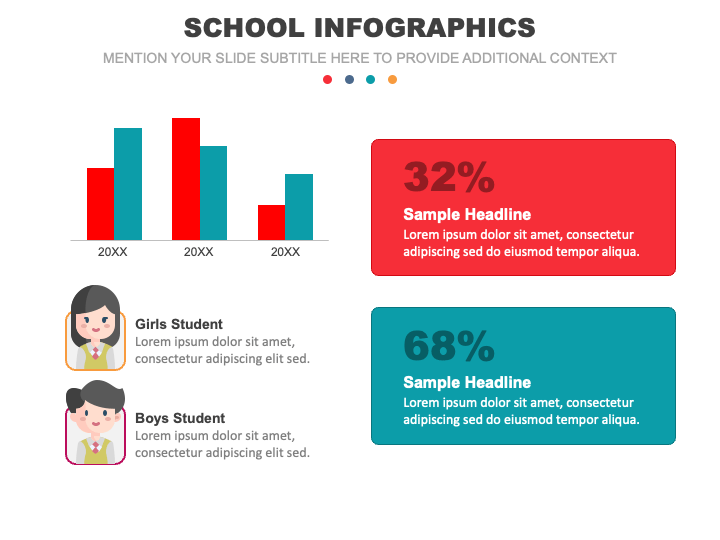
- The boy and girl student ratio in a specific class can be highlighted via demographics and a bar graphic infographic.
- A tabular illustration can be used to showcase the breakdown of the total fee structure in different categories, such as tuition fee, transportation cost, stationary and books, and more.
Features
- Entirely editable graphics
- Assured high-resolution
- 24/7 customer support
- Reusable for a lifetime
- Copyright-free
Download this set without any second thought!
Write Your Own Review

Related Products


