


Similar Products
- Sale

- Sale
- Sale
- Sale
- Sale
- Sale

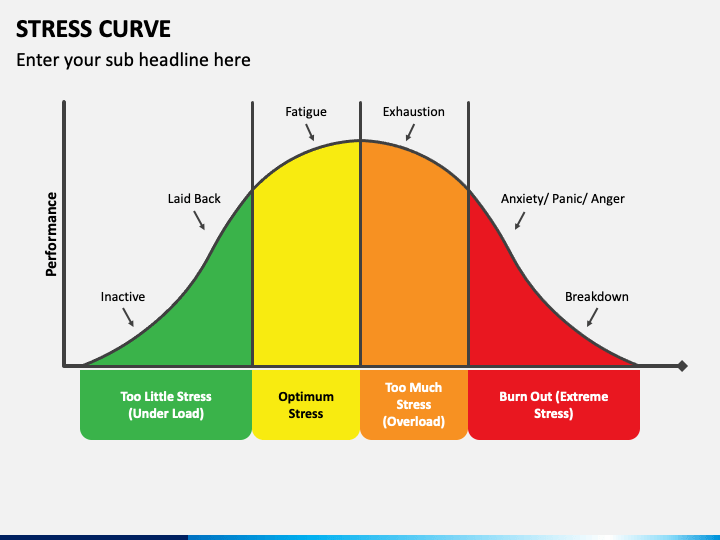
Our ready-made Stress Curve PPT template is the perfect pick for psychologists to portray the relationship between pressure and performance. Counselors and consultants can leverage the uniquely designed curve infographics to explain the negative and positive consequences of extreme pressurized situations. HR managers and industrial trainers can also capitalize on the curve illustrations to showcase how less-pressured situations cause boredom in employees and how managers and leaders can get rid of such situations and motivate employees to take challenges and give their best.
Let’s Look at the Slides’ Design
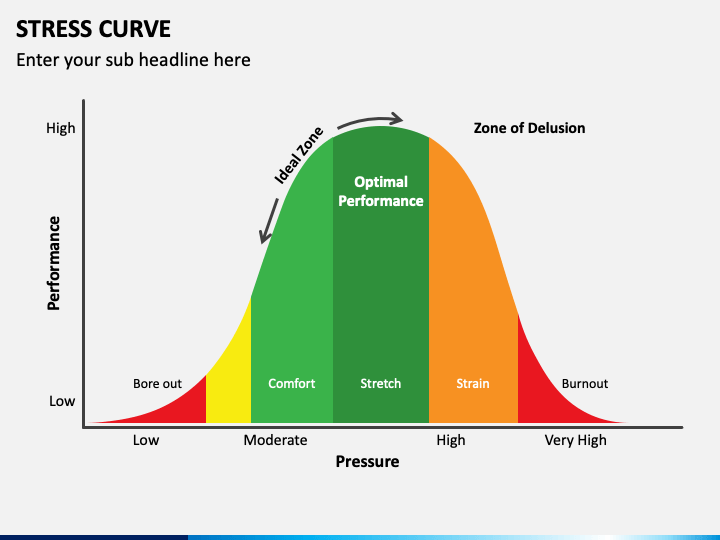
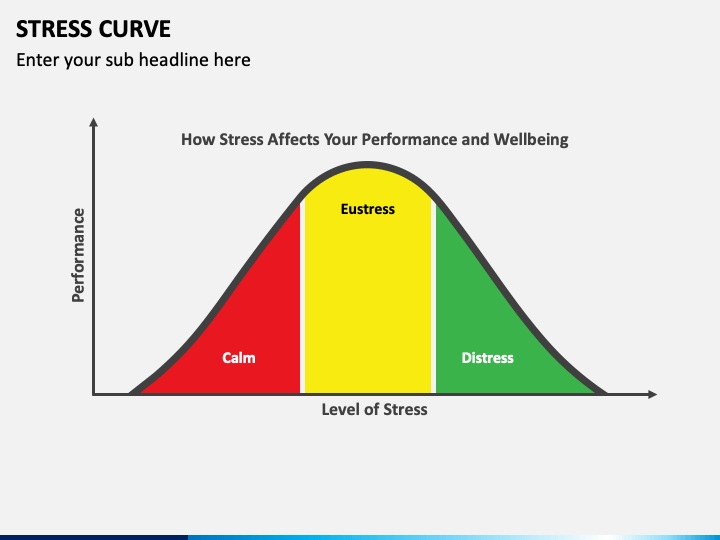
The PowerPoint slides feature multicolor curve diagrams representing pressure, performance and stress levels and the impact on human productivity and wellbeing. You can also capitalize on the visuals to explain the correlation between pressure, performance, and stress.
Salient Features
- No technical skills are required by the users to make the deck elements in line with their objectives.
- The high-quality graphics offer uninterrupted resolution and quality on all screen dimensions.
- A dedicated customer support team is available round-the-clock.
Download the set once to own it forever!
Write Your Own Review

Related Products


