Task Infographics for PowerPoint and Google Slides
(5 Editable Slides)
Task Infographics for PowerPoint and Google Slides
SB16648
Available For
Similar Products
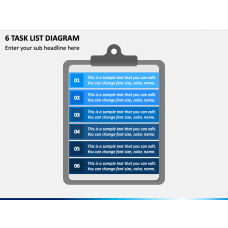
Lay your hands on our Task Infographics for PowerPoint and Google Slides to display various tasks and activities associated with a process, project, or business operation. Project managers can visualize the overall project plan, including project timelines, key deliverables, and dependencies, ensuring every team member is on the same page. Team leaders can capitalize on beautiful graphics to showcase the assignment of tasks based on priority, responsible team members for a specific task, and the end date for completion. This graphic-rich deck also comes in handy to display task status.
The slides comprise
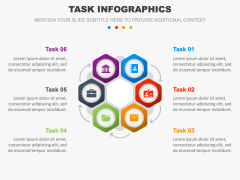
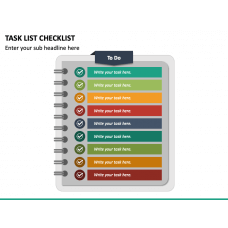
- an infographic presenting quadrilateral-shaped boxes with self-explanatory icons
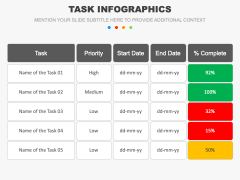
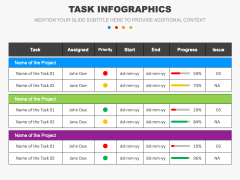
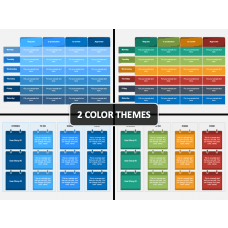
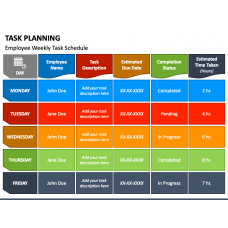
- table diagrams showcasing the name of tasks, responsible person, priority, start and finish date, issue, and completion status in percentage
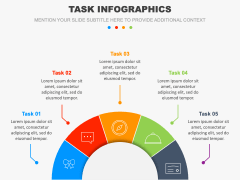
- an illustration of a semicircle divided into 5 parts
The editable textual boxes in each slide allow you to insert the desired content.
Features
- Customizing the graphics doesn’t require prior editing knowledge or special software.
- Project the graphics on any screen without fretting about the optical resolution loss.
- Each set attribute has been thoughtfully designed to keep copyright issues at bay.
Grab this pre-designed PPT now!
Write Your Own Review


