
Tourism Infographics for PowerPoint and Google Slides
(10 Editable Slides)

Tourism Infographics for PowerPoint and Google Slides

SB16749
Available For


We have introduced Tourism Infographics for PowerPoint and Google Slides to help you display intricate details in a clear and visually compelling manner. Travel agencies can use these versatile infographics to showcase key attractions, landmarks, and things to do in a specific travel destination. Tourism boards and marketers can visualize statistics about visitor numbers, the best travel months, and demographic details. Tour operators can highlight the average cost of accommodation, meals, transportation, and activities for a specific trip.
Educators and history enthusiasts can provide insights into a particular country or city’s cultural heritage and historical sites. Adventure sports and travel companies can illustrate the adventurous side of a destination, such as hiking, water sports, and wildlife experiences, attracting tourists. Food bloggers can capitalize on these stunning visuals to present diverse culinary offerings, food festivals, and popular dining spots in a city, state, or country. Eco-conscious travelers and environmentalists can display data on eco-friendly initiatives, sustainable accommodations, and responsible tourism practices.
A Glance at Slides’ Design
- You can start your presentation well via our striking cover slide.
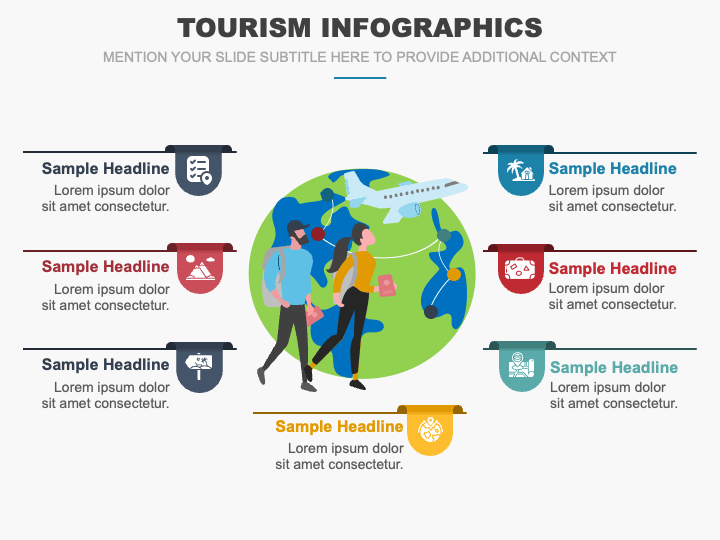
- The popular tourist destinations worldwide can be showcased through an infographic of a globe with a male and female and an airplane.
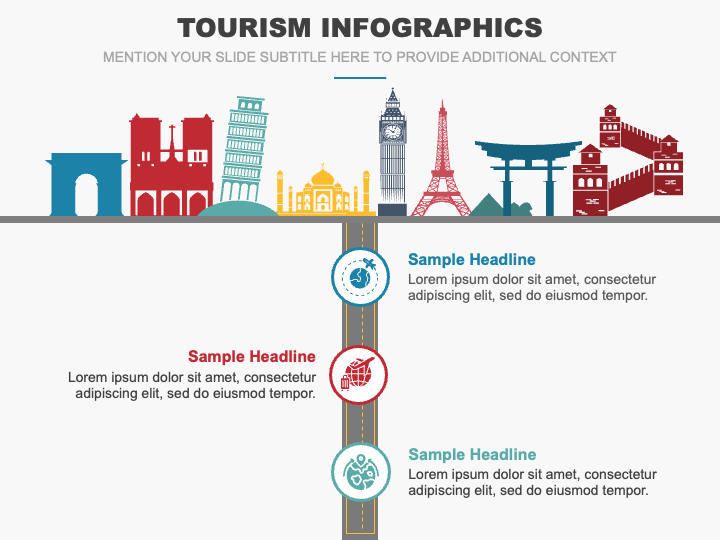
- The details about famous tourist places across the globe can be presented with clarity.
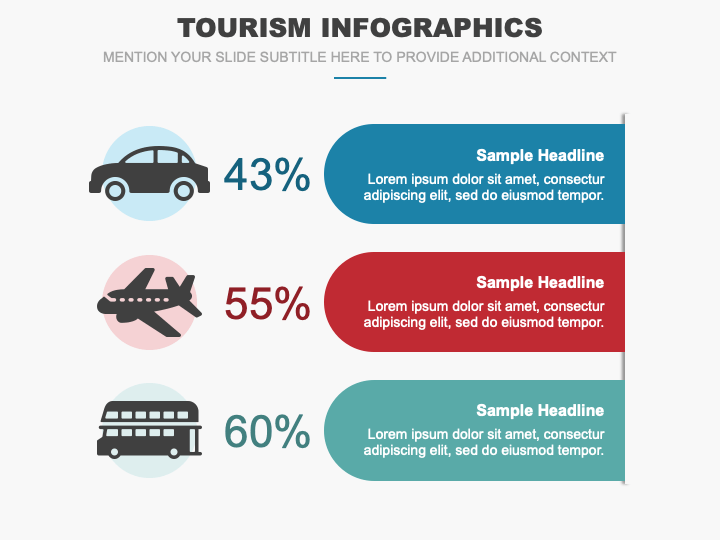
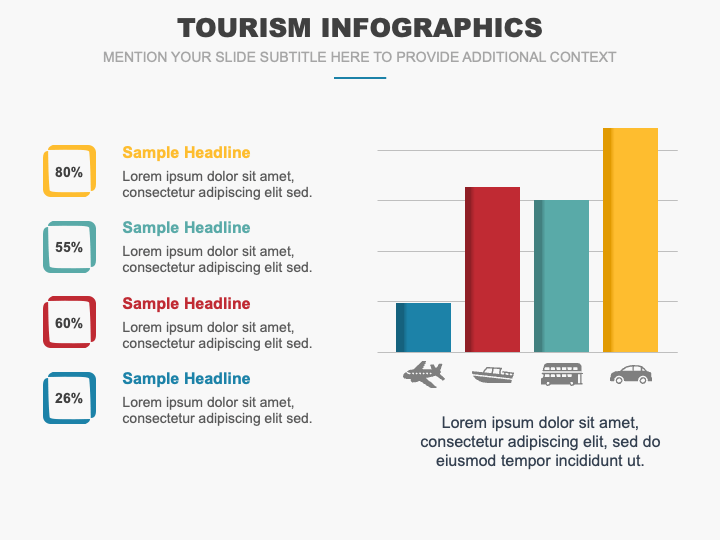
- Using an exquisite illustration, you can depict the percentage of people who prefer to travel by car, bus, or airplane.
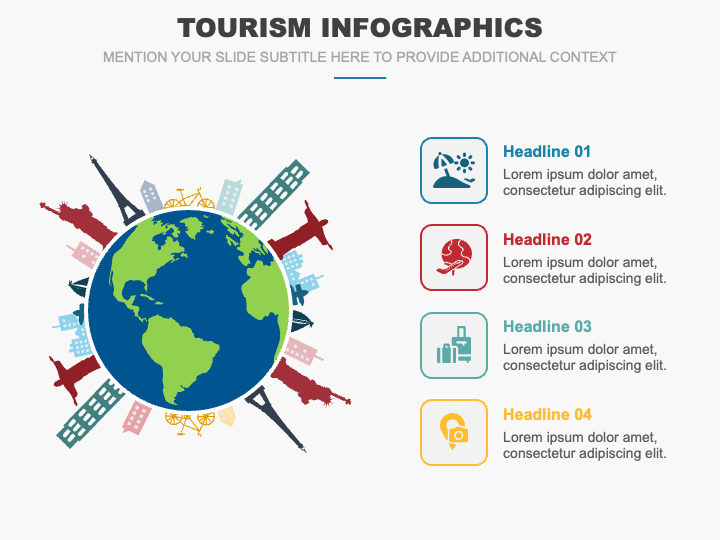
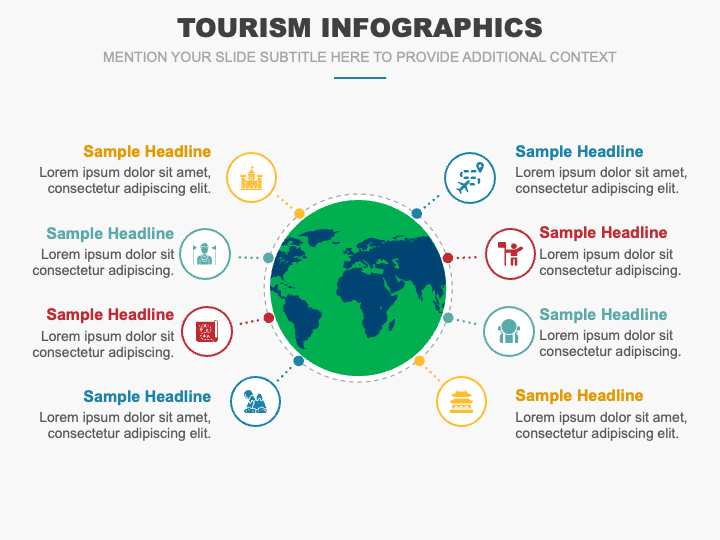
- The intricacies of each famous destination can be illustrated using an illustration of a globe.
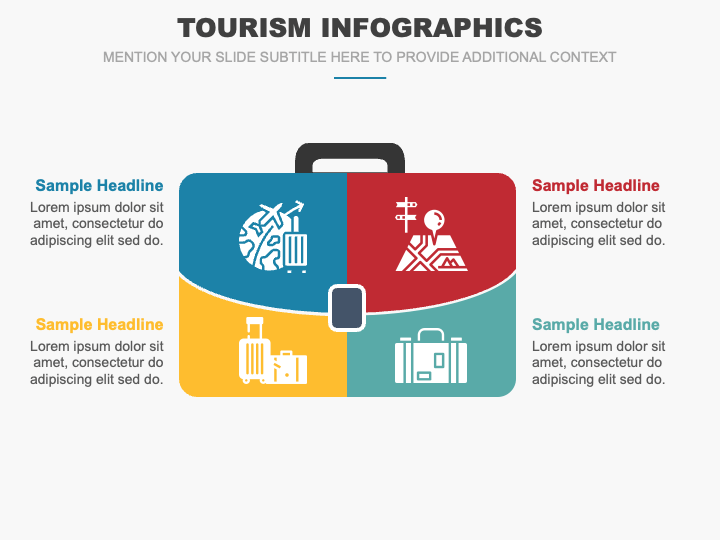
- A suitcase infographic can be used to highlight travel essentials.
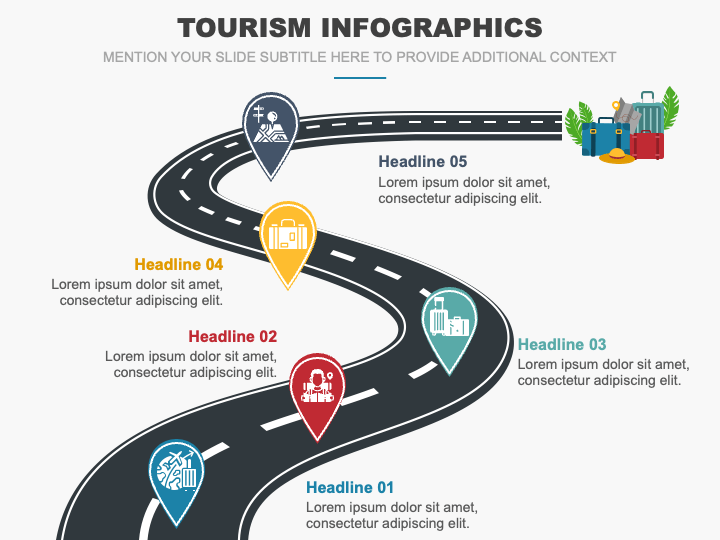
- A zigzag road infographic can be used to illustrate the travel itinerary.
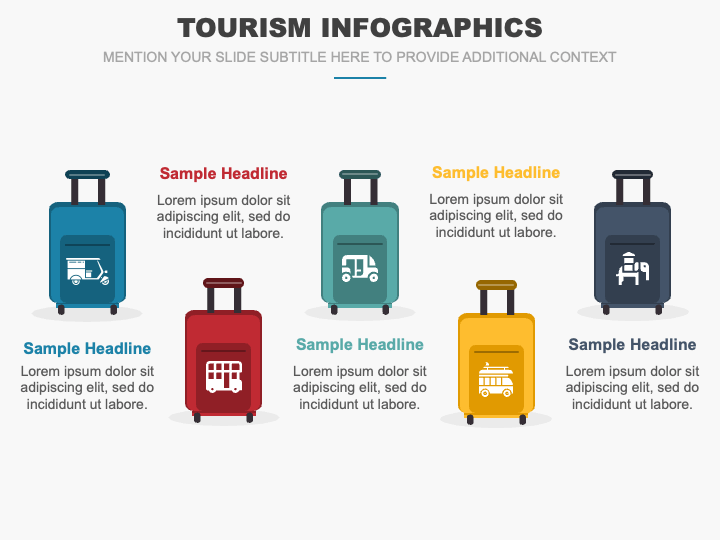
- An illustration of several suitcases can be used to display responsible and safe travel practices.
- An infographic of the planet Earth can be used to portray the crucial role of tourism in the global economy, the environmental impact of tourism, how technology has transformed the tourism industry, etc.
- A bar graph can be used to depict the statistics related to popular modes of travel.
Features
- Tailor the graphics to match your presentation’s theme without confronting challenges.
- Each visual ensures the same quality and resolution, even when projected on a widescreen.
- Our experienced designers have thoughtfully designed the set to eliminate the scope for copyright issues.
Grab this graphic-rich PPT now!
Write Your Own Review

Related Products


