
World Cancer Research Day Presentation - Free Download
(15 Editable Slides)


World Cancer Research Day Presentation - Free Download

SBNEWF863
Available For


Every year on September 24th, World Cancer Research Day is observed. The day aims to highlight the importance of cancer research endeavors in slowing down the progression of the disease and enhancing the survival rates and overall well-being of individuals affected by it. It provides an opportunity to recognize the efforts of researchers, healthcare professionals, patients, and supporters in this ongoing battle. Moreover, healthcare professionals leverage this occasion to educate the audience about the facts to dispel myths and misconceptions about cancer, encouraging governments to take action against this deadly disease.
Download our World Cancer Research Day template for PowerPoint and Google Slides to showcase the advancements in cancer treatment, early detection methods, and cure for various types of cancer. The light pink backdrop beautified with compelling visuals makes the slides perfect for adding an aesthetic touch to your presentations and impressing your viewers.
What’s Inside the Deck?
- You can use our cover slide to start your presentation well.
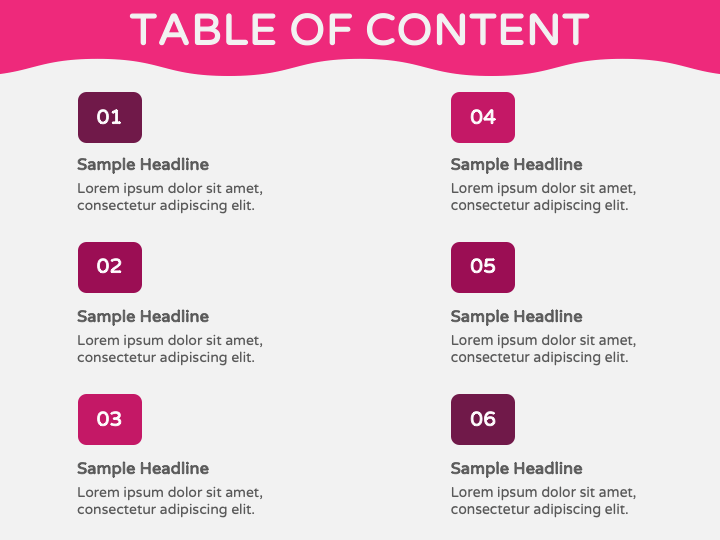
- Showcase your presentation’s agenda with the Table of Contents slide.
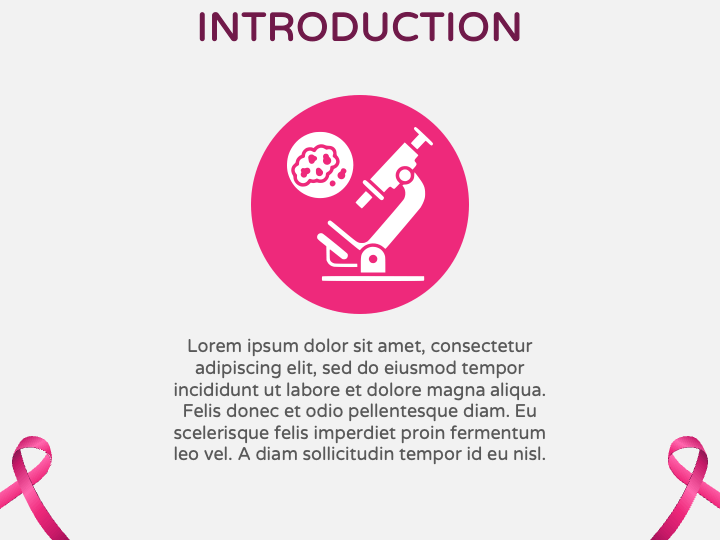
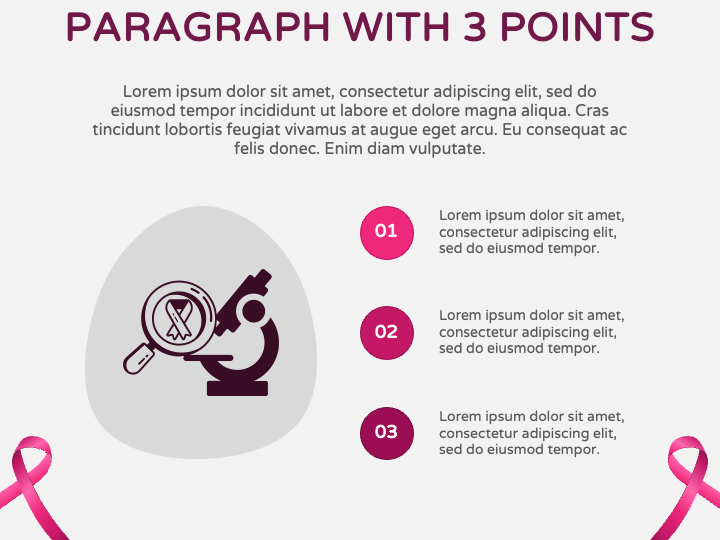
- You can illustrate an overview of your topic via an infographic of a microscope.
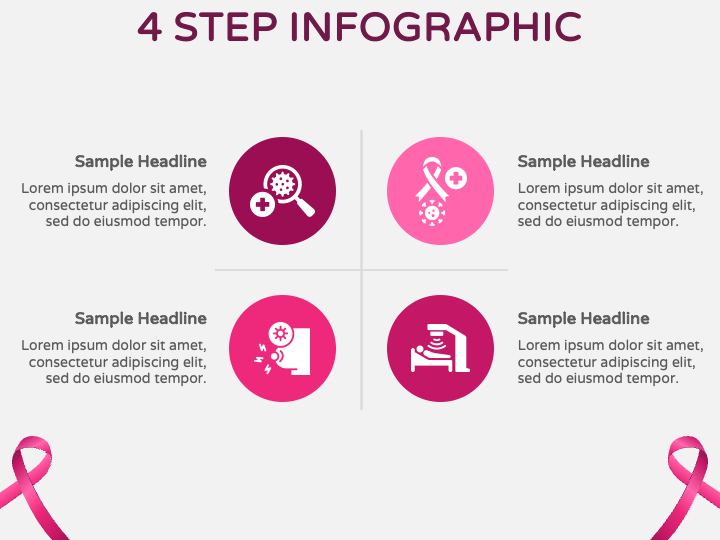
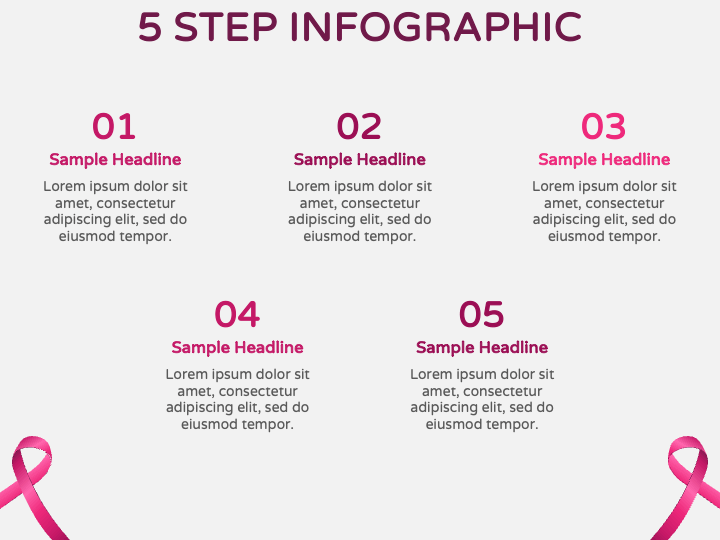
- With four and five-step infographics, you can exhibit the significant milestones and breakthroughs in cancer research.
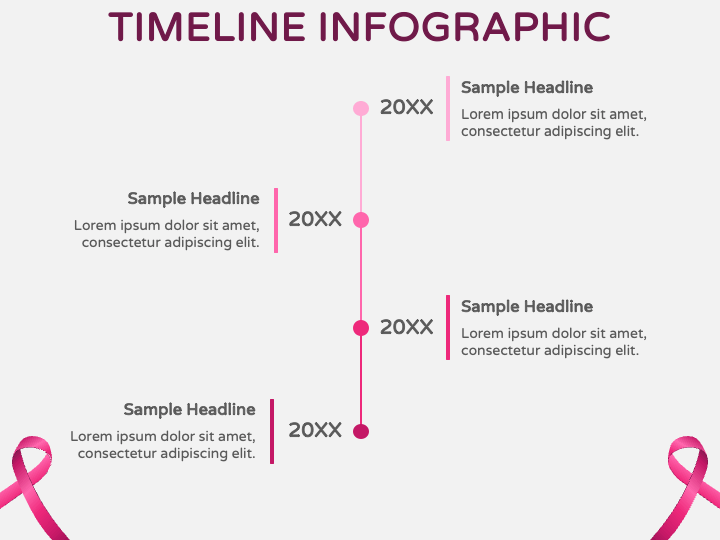
- The timeline infographic can be used to display the journey and progress in treating and preventing cancer.
- Portray notable quotes about ongoing cancer research via a quote infographic.
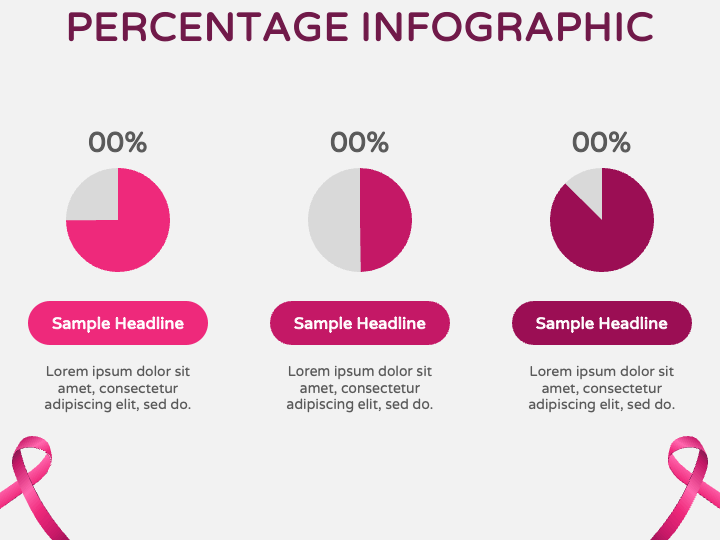
- Use pie charts to depict funding allocation across different areas of cancer research, the distribution of various types of cancer, survival rates, etc.
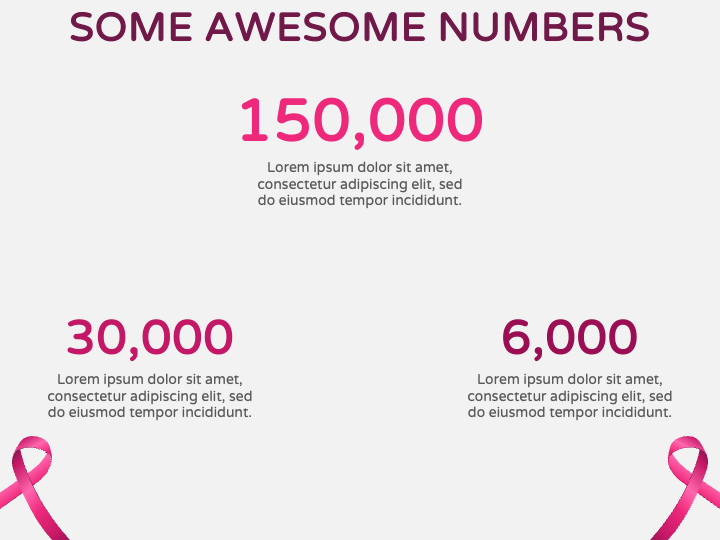
- The stats layout can be used to display the number of scientific publications related to cancer research per year, the number of clinical trials for different cancer treatments, the success rates of clinical trials, and more.
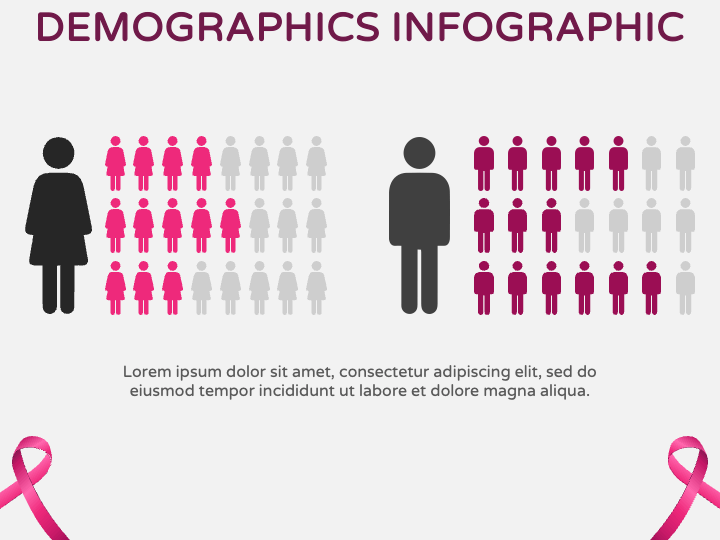
- The prevalence of cancer based on age and gender groups can be illustrated through a demographics infographic.
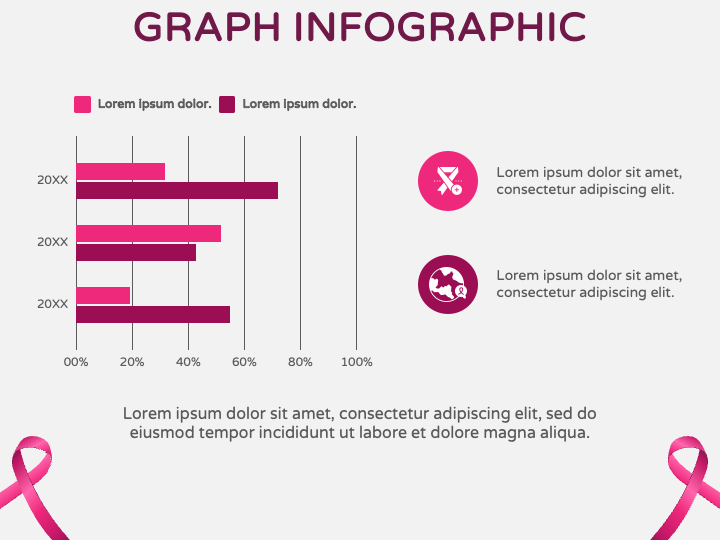
- Use the bar graph to showcase the cancer incidence rates, survival rates by cancer type, and more.
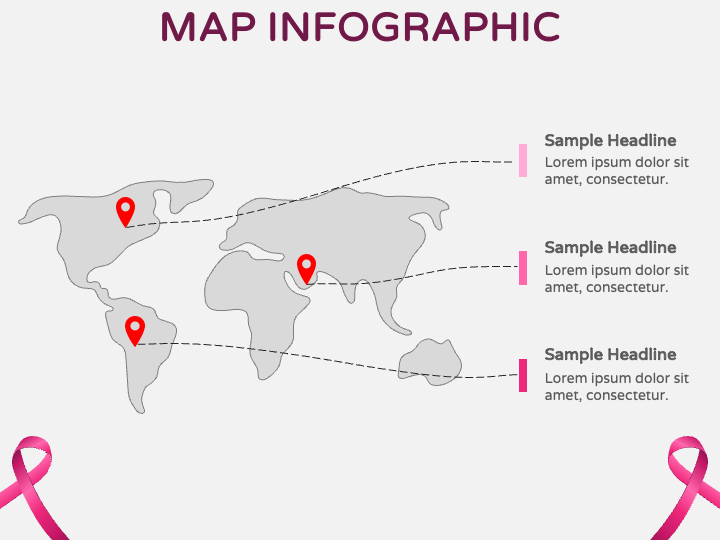
- Present the global distribution of cancer incidence rates, regions with higher rates of specific cancer types, advocacy efforts, etc., using a map diagram.
- Thank your audience for their interest and time throughout the presentation with our ‘Thank You’ slide.
Features
- Hassle-free editing
- High-definition graphics
- 24/7 customer support
- Copyright-safe
Transform boring presentations into engaging ones with this PPT; download it now!
Write Your Own Review

Related Products


