


Similar Products
-

-
- Sale
-
- Sale
- Sale


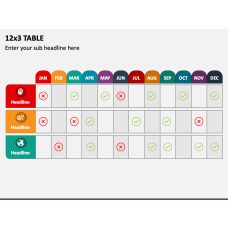
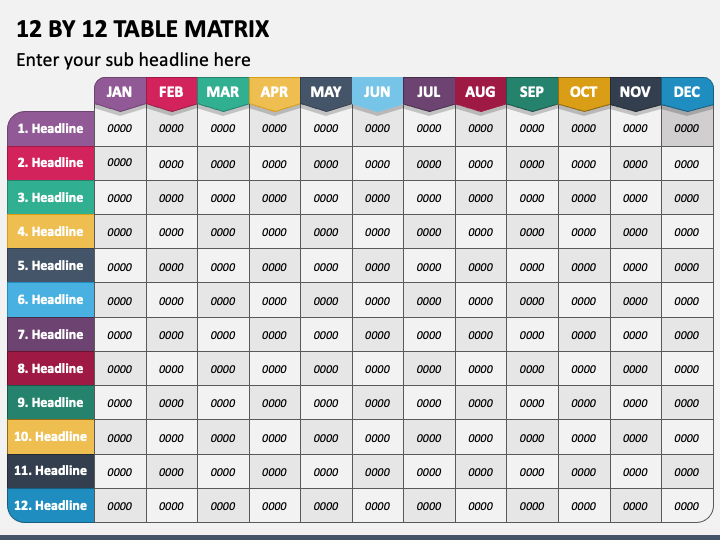
Download our multipurpose 12 by 12 Table Matrix slide for MS PowerPoint and Google Slides to give your data and information a visual perspective and make your presentations more engaging. The slide features a tabular infographic of twelve columns and twelve rows, providing ample space to present complex information in an organized manner.
Sales professionals can capitalize on this graphic to visualize the sales figures, profitability, and revenue of different products over a 12-month period. Project managers and team leaders can use it to communicate performance metrics to their team members while highlighting project progress status. Moreover, the illustration is the best pick to highlight the budget allocation among different departments and projects.
Impressive Features
- Users don't need prior editing knowledge or external assistance to modify the graphic.
- The visual will maintain its resolution even on bigger screens.
- No user will encounter copyright issues, as the entire visual is designed after thorough research.
- Get a quick response to your queries by contacting our 24/7 customer service agents.
Present your content with excellence by using this completely editable slide; download it now!
Write Your Own Review

Related Products


