12 By 7 Table Matrix
12 By 7 Table Matrix
(1 Editable Slide)
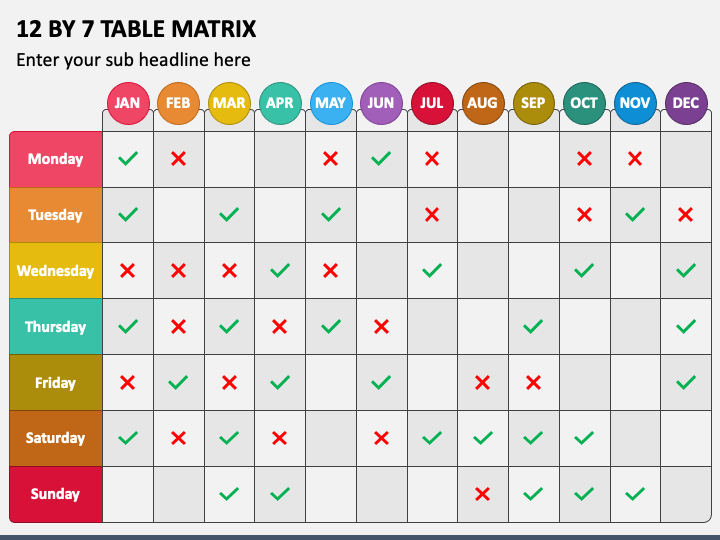
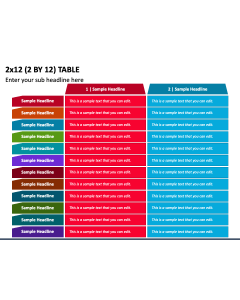
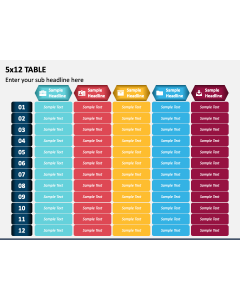
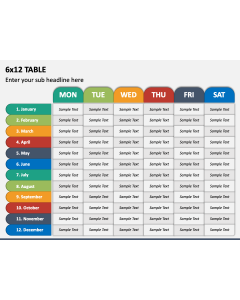
Lay your hands on our 12 By 7 Table Matrix presentation graphic for PowerPoint and Google Slides to provide meaningful insights from a large set of data to your audience. The slide features a tabular infographic of twelve columns and seven rows, where the column represents months and the rows the days.
Team leaders can use this illustration to visually communicate the to-do list to their team members and status report of different tasks and activities to their seniors. Digital marketing experts can also capitalize on this visual to present monthly metrics, such as click-through, conversion and engagement rates, for different marketing campaigns.
Excellent Features
- You get complete freedom to change the illustration to your liking without any difficulty.
- Our team has conducted meticulous research before creating each object to avoid copyright problems.
- The graphic retains its high quality, even when projected on a bigger screen.
- Our support team is available 24/7 to assist you with any queries or concerns.
Use this multi-use visual to bring your content to life and make it more engaging!
