

6x9 Table for PowerPoint and Google Slides
6x9 Table for PowerPoint and Google Slides
(1 Editable Slide)
Product Details
(1 Editable Slide)
Available For
PowerPoint
Keynote
Google Slides
Canva Slides
Animation:
Yes
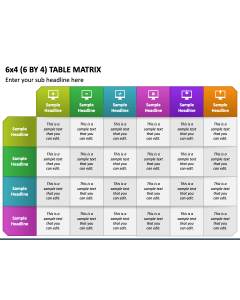
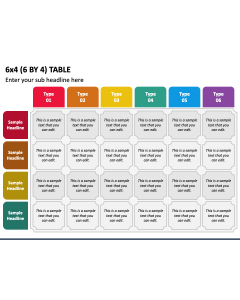
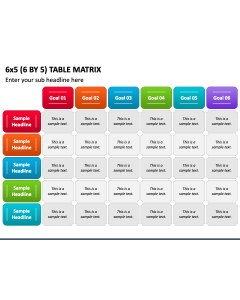
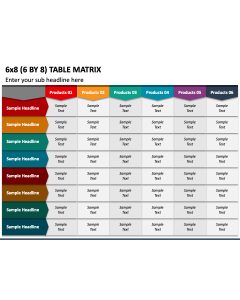
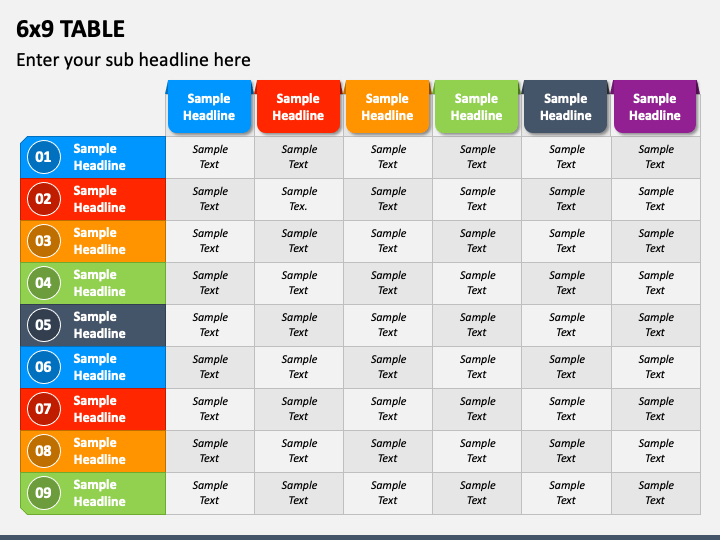
Use our 6x2 Table Infographic slide for Microsoft PowerPoint and Google Slides to give an eye-pleasing look to your presentations. The slide features a tabular illustration of six columns and two rows; each cell is beautified in different background color contrast. It is adorned with appealing icons and provided with editable text placeholders.
Using this multi-use infographic, researchers can portray the summarized survey results, like how different demographic groups respond to a particular product or service. Finance managers can leverage this tabular diagram to present financial information, such as revenues and expenses for different departments or products.
Salient Features
- No user needs knowledge of special tools to modify the graphic.
- The illustration maintains its exceptional quality, even when showcased on a larger screen.
- The users won’t encounter copyright issues, as everything has been designed after thorough research.
- Our customer support executives are available around the clock to address all your queries and concerns.
Download this PPT right away to enrich your presentations!