

Free - 6 by 9 Table for PowerPoint and Google Slides
Free - 6 by 9 Table for PowerPoint and Google Slides
(1 Editable Slide)
Related Presentation Templates
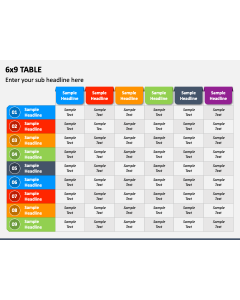
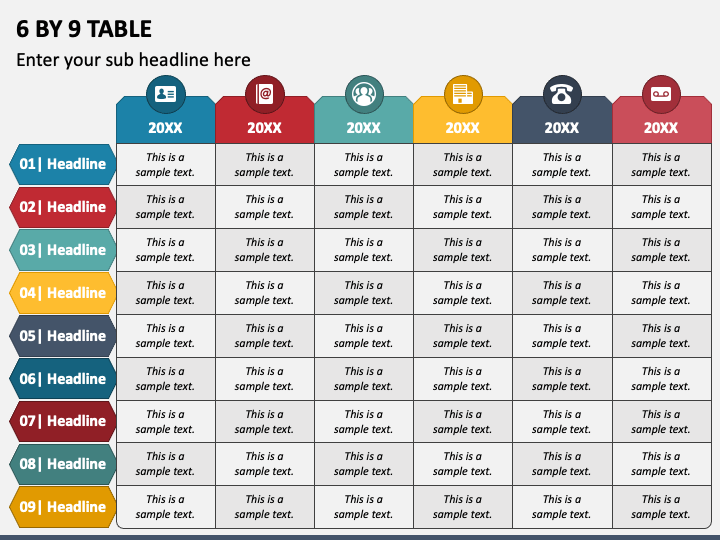
Present complex information into digestible snippets with our 6 By 9 Table slide designed for Microsoft PowerPoint and Google Slides. The PPT showcases a visually appealing table diagram featuring six columns with eye-catching icons and nine rows with serial numbers. The customizable text placeholders let you add a personalized touch to your content. The striking color combinations used in the illustration add to its overall appeal.
Finance managers can capitalize on this exclusively created PPT to represent the financial performance over the last six years, the projections for the upcoming years, and much more. Entrepreneurs and C-suite executives can demonstrate the change in trends or patterns across the industry. Real estate agents can also illustrate the prices of land and properties of specific regions over the last six years.
Key Features
- The infographic has been created from scratch to ensure you don't face copyright problems.
- You can present the visual element on a large screen without fretting about the resolution.
- You can resize the vector and change the background color without technical skills or knowledge.
Download this outstanding slide now to leave a lasting impression!