


Similar Products
-

-
- Sale
-
- Sale
- Sale


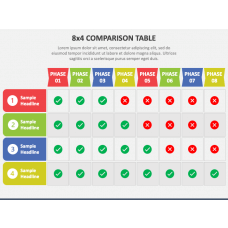

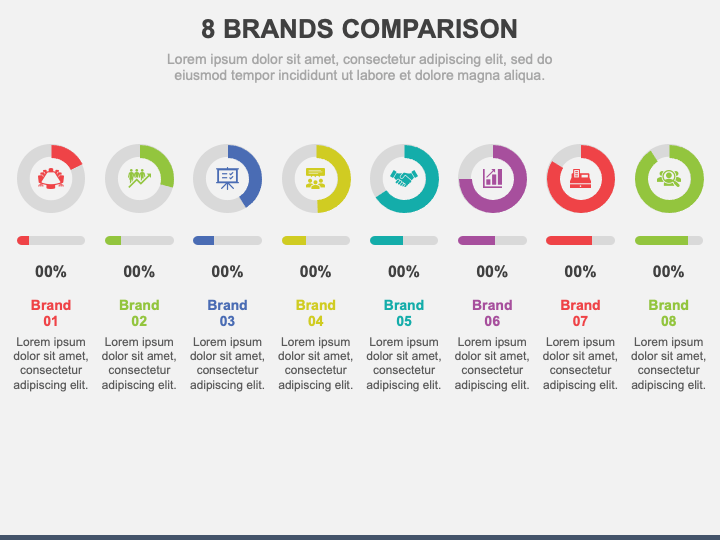
Use our 8 Brands Comparison graphic for PowerPoint and Google Slides to give your textual information a visual perspective and help your audience process the key takeaways quickly. The slide comprises various donut charts adorned with appealing icons and bright colors. Editable textual boxes are provided to put the desired content.
Business development and marketing professionals can showcase an insightful comparative overview of brands of the specific industry, unveiling their key features, strengths, unique offerings, etc. Sales experts can depict the market share, customer experience, key success factors, profit margins, sales volume, and other information of the leading brands to the top management, enabling them to make informed decisions.
Features
- You can conveniently alter and adjust the graphic to suit your preferences.
- The design elements will deliver uninterrupted resolution, even when projected on a bigger display.
- Our designers have crafted the illustration to eliminate the room for copyright violation issues.
Get this PPT to enhance the visual appeal of your presentations!
Write Your Own Review

Related Products


