

Free - 8 Column Table for PowerPoint and Google Slides
Free - 8 Column Table for PowerPoint and Google Slides
(1 Editable Slide)
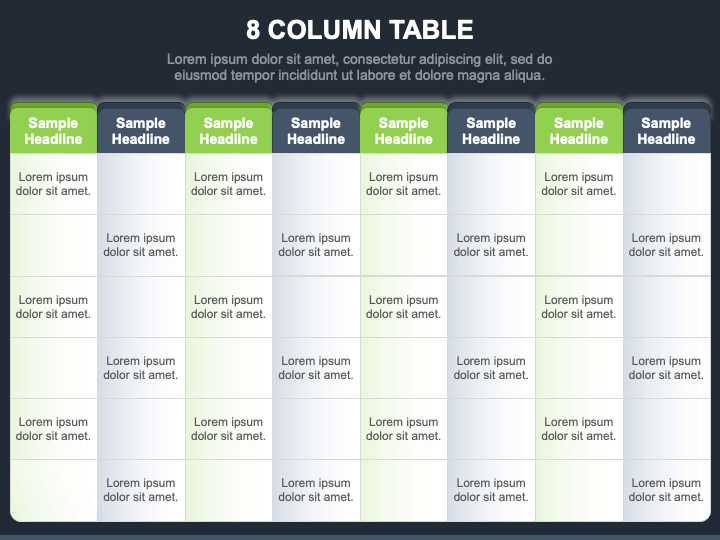
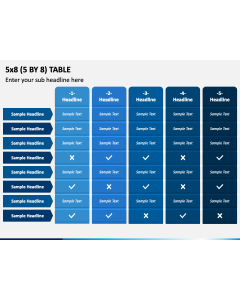
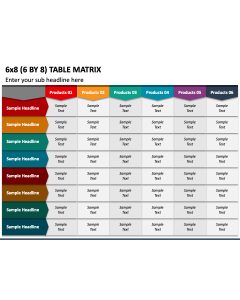


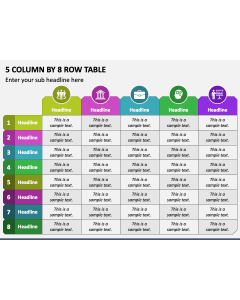
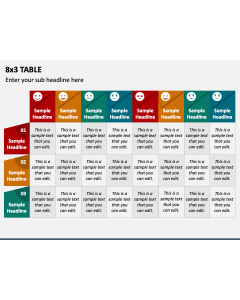
Get your hands on our 8 Columns Table slide for PowerPoint and Google Slides to enhance the visual appeal of your presentations and give your content a structured look. The slide comprises a tabular infographic of eight columns adorned with editable cells.
Project managers can leverage the illustration to showcase the stages of a project lifecycle, key milestones, resource allocation, deliverables, deadlines, etc. Market analysts can highlight a comparative market landscape analysis, helping internal teams make informed decisions. Team leaders can use this versatile graphic to depict group and individual performance to HR managers and upper-level management, facilitating performance reviews and goal-setting. Financial experts can also illustrate financial data in an easy-to-comprehend manner. Further, you can display product and service comparisons, content calendars, event schedules, etc.
Features
- You can quickly make the changes according to your requirements without comprehensive technical skills or external aid.
- The design elements won’t get interrupted, even when projected on a bigger screen.
- Our experienced designers have meticulously designed the illustration to avoid copyright issues.
Make this PPT yours now!