Budget Infographics for PowerPoint and Google Slides
(5 Editable Slides)
Budget Infographics for PowerPoint and Google Slides
Available For
Get your hands on our Budget Infographics for PowerPoint and Google Slides to enrich your textual information and facilitate a better understanding among your audience. Business consultants can capitalize on this set to depict the importance of budgeting for business growth. Financial experts can leverage this graphic-rich template to represent the factors to consider while creating a personal budget. CFOs can showcase budget allocation across different departments, tips for better utilizing the allocated budget, etc.
Educators can use these visuals in their presentations to showcase types of budgets and crucial elements of a budget. Journalists and economists can illustrate the key insights into the annual budget shared by the government. You can also display best practices for budgeting, popular budgeting tools and software, and more.
A Closer Look at the Slides’ Overview
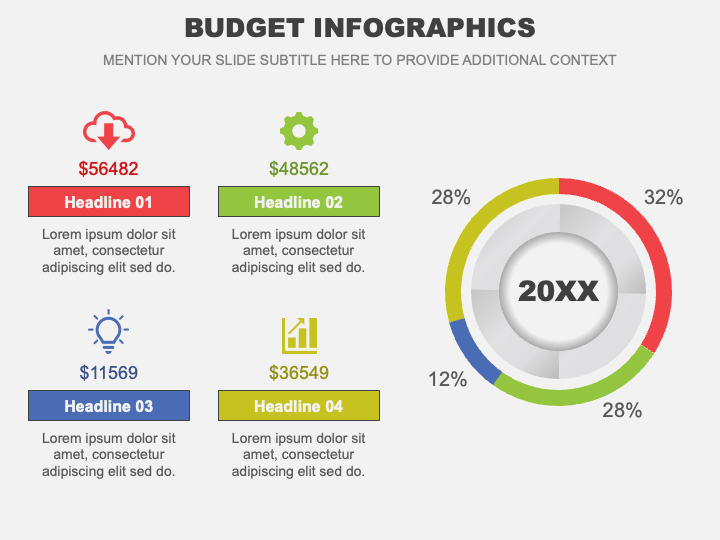
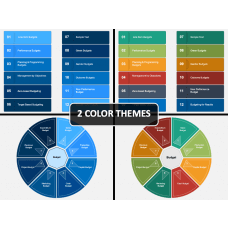
- A donut chart with self-explanatory icons can be used to depict budget distribution across different organizational tasks in a particular year.
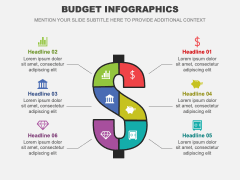
- An infographic of a dollar sign can be used to highlight key components of an operating budget.
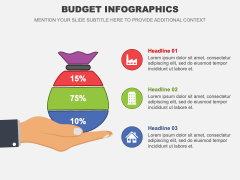
- Present the importance of segregating income into different categories, such as emergency funds, savings, and daily expenses, through an eye-pleasing illustration.
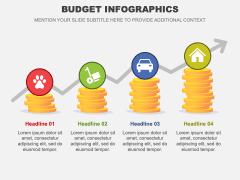
- An infographic of coin stacks can be used to display the significance of regular saving and investing for achieving long-term goals.
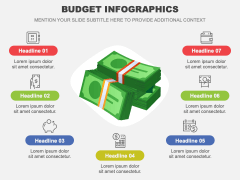
- Different investment options to build wealth can be showcased via an infographic of currency bundles.
Features
- User-friendly editing allows users to customize the deck components effortlessly.
- Projecting the visuals on any screen dimension won’t affect their original quality and resolution.
- Everything has been thoughtfully designed to avoid copyright infringement issues.
Elevate your slideshows with this PPT; download it now!

