
E-Commerce Infographics for PowerPoint and Google Slides
(9 Editable Slides)

E-Commerce Infographics for PowerPoint and Google Slides

SB16723
Available For


Leverage our E-commerce Infographics for PowerPoint and Google Slides to display voluminous information in an organized and easy-to-comprehend manner. Market analysts can use these infographics to display global e-commerce growth over the years, the age and gender distribution of online shoppers, and more. Business consultants can illustrate different types of e-commerce business models.
Marketers and UI/UX designers can highlight the percentage of users shopping via mobile and the importance of tailoring marketing strategies accordingly. Product managers can illustrate the top product categories in e-commerce and the pivotal role of consumer preference trends in inventory planning. You can also depict the e-commerce market share by region, competitive landscapes, and more. Furthermore, you can exhibit common challenges in e-commerce and solutions for addressing them.
A Sneak Peek at the Slides’ Design
- A captivating cover slide is provided to help you begin your presentation in style.
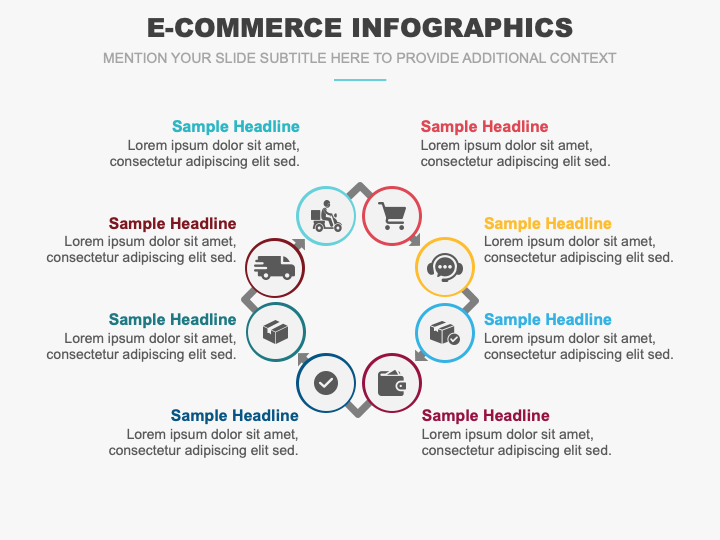
- You can highlight touchpoints of a customer’s journey from awareness to conversion via a quadrilateral-shaped illustration adorned with appealing icons.
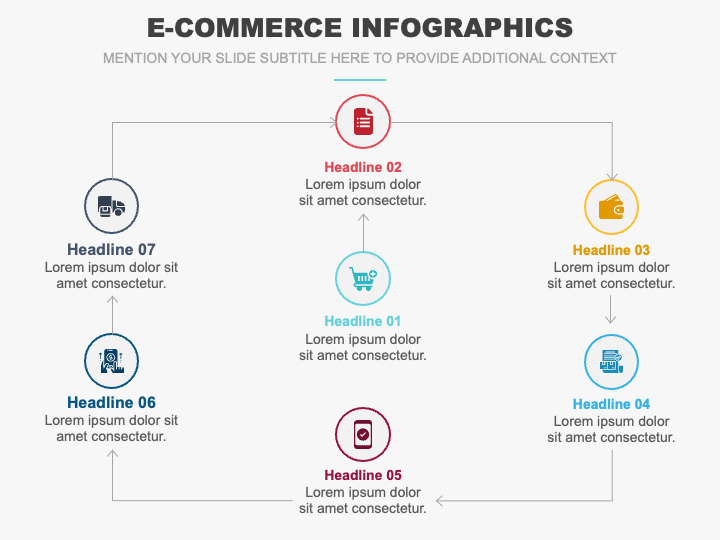
- A flowchart diagram can be used to depict the types of e-commerce marketing and their characteristics.
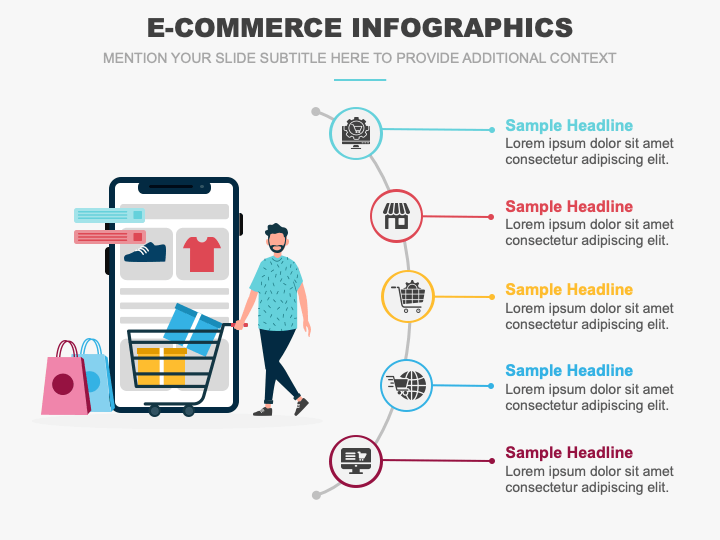
- Use an infographic of a smartphone to portray the top product categories in e-commerce.
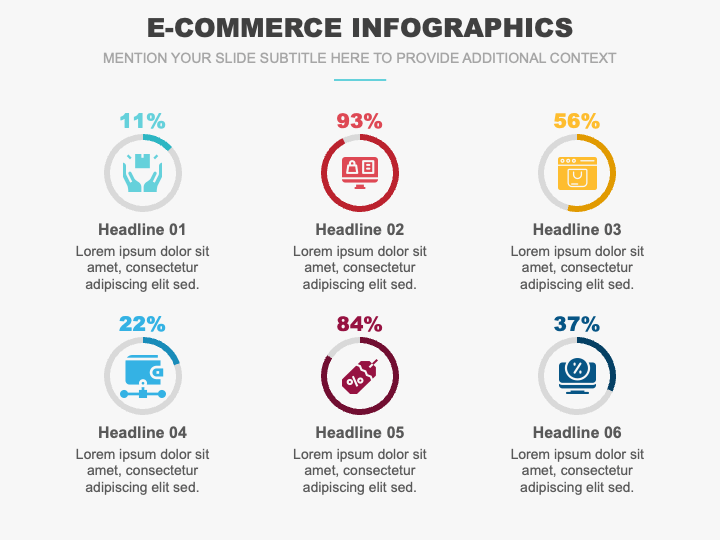
- Portray the portion of e-commerce transactions that occur through mobile devices, the market share of e-commerce companies, the payment methods used for online shopping, etc., via donut charts.
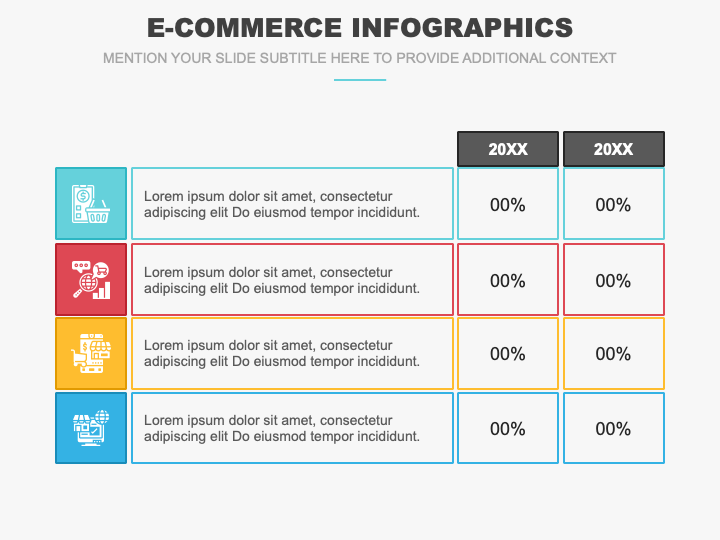
- A tabular infographic can be used to depict the e-commerce trends over the years.
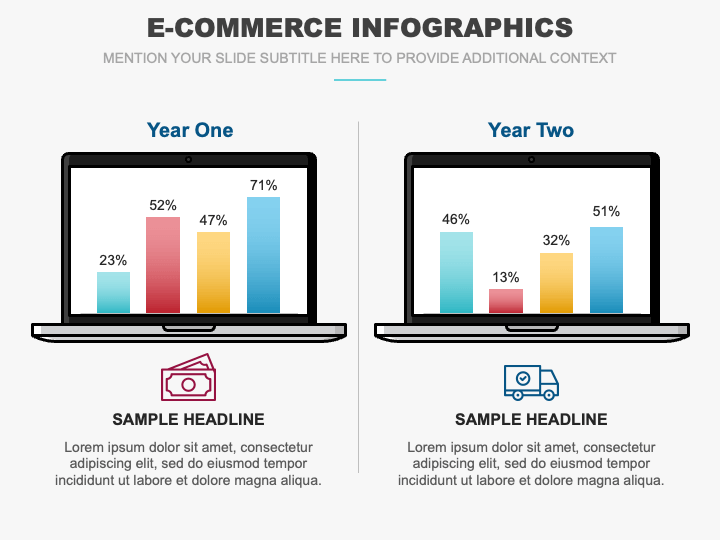
- The yearly comparison of e-commerce sales can be presented via a comparison diagram.
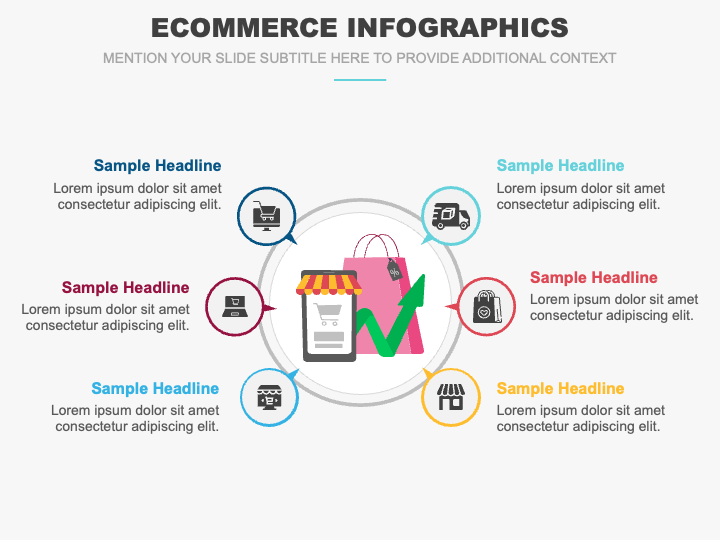
- An infographic of a shopping bag with a mobile device can be used to showcase the factors influencing online shopping behavior.
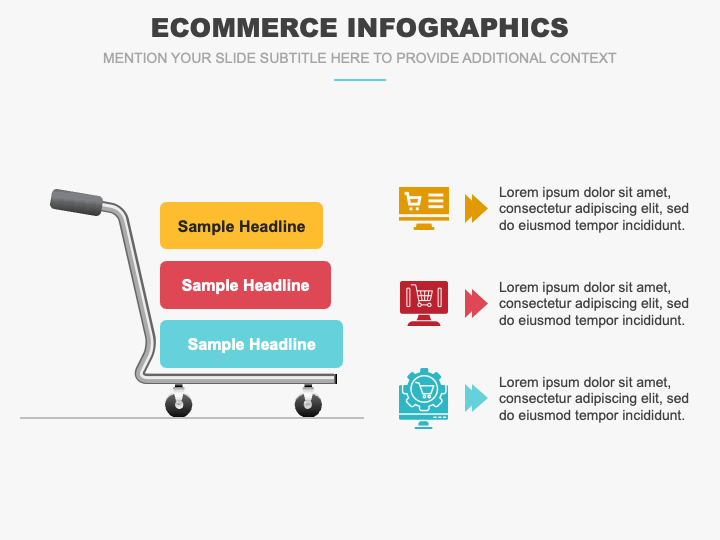
- A shopping cart graphic can be used to display challenges in e-commerce.
Features
- You can make the desired changes in the deck effortlessly.
- All graphics retain their original quality, even when projected on a widescreen.
- Each set attribute has been crafted from scratch to eliminate the room for copyright breach incidents.
Download this power-packed PPT to elevate your slideshows!
Write Your Own Review

Related Products


