
Financial Performance Highlights Presentation
(1 Editable Slide)

Financial Performance Highlights Presentation

SB16510
Available For


Similar Products
- Sale

- Sale
- Sale
- Sale
- Sale
- Sale


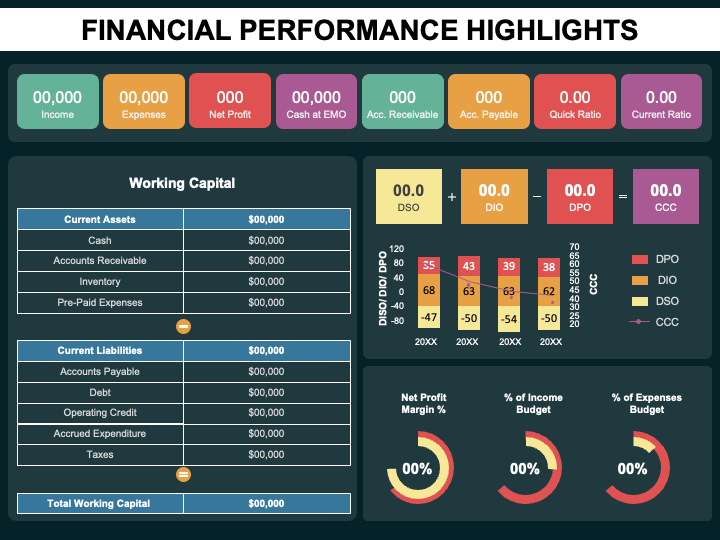
Use our Financial Performance Highlights slide for PowerPoint and Google Slides to provide a snapshot of a company’s financial health and achievements. The slide comprises a dashboard representing a table, bar graphs, donut charts, and more. It is seamlessly integrated with Excel, ensuring that any modifications made in the Excel file will be instantly mirrored in the dashboard.
Senior executives can use this layout to portray the key financial metrics, including revenue growth, gross and net profit margins, cash flow, ratios like ROA and ROE, debt levels, etc., before stakeholders. You can use this slide to explain how financial highlights play a pivotal role in enabling lenders and creditors to evaluate a company’s ability to meet its debt obligations. Furthermore, you can explain how these highlights offer analysts crucial insights, empowering them to provide well-informed investment recommendations.
Features
- Entirely editable
- Assured high-resolution
- Copyright-free
- 24/7 customer support
Download the slide immediately to add a visual impact to your presentations!
Write Your Own Review

Related Products


