

International Men's Day Presentation - Free Download
International Men's Day Presentation - Free Download
(17 Editable Slides)

Related Presentation Templates


November 19th each year marks International Men’s Day to appreciate the value men bring to the world, their families, and society. The day aims to create awareness of issues affecting males worldwide, promote gender equality, and highlight influential male role models. It is an opportunity to acknowledge men’s contributions and achievements in various fields, address men’s mental and physical health and gender stereotypes, and promote healthy relationships. Further, this global occasion provides an opportunity for everyone to honor the men in their lives and make them feel special and valued.
Use our International Men’s Day template for PowerPoint and Google Slides to display the importance of celebrating men and taking action to improve their well-being and quality of life. With a blend of white and sky-blue hues in the background and striking visuals, these slides convey your message with impact and conviction, improving comprehension and retention.
A Closer Look at the Slides
- You can make your presentation’s start memorable using our stunning cover slide.
- Illustrate your presentation’s agenda with the Table of Contents slide.
- Portray a summary of your topic through an eye-pleasing infographic.
- Using two, three, and six-step infographics, you can exhibit the challenges faced by men across different fields, their contributions, and more.
- Showcase the traits of men using a ‘features’ infographic.
- Illustrate the quotes about men with clarity.
- You can use the percentage infographic to display the percentage of men affected by common health issues, experienced discrimination, and more.
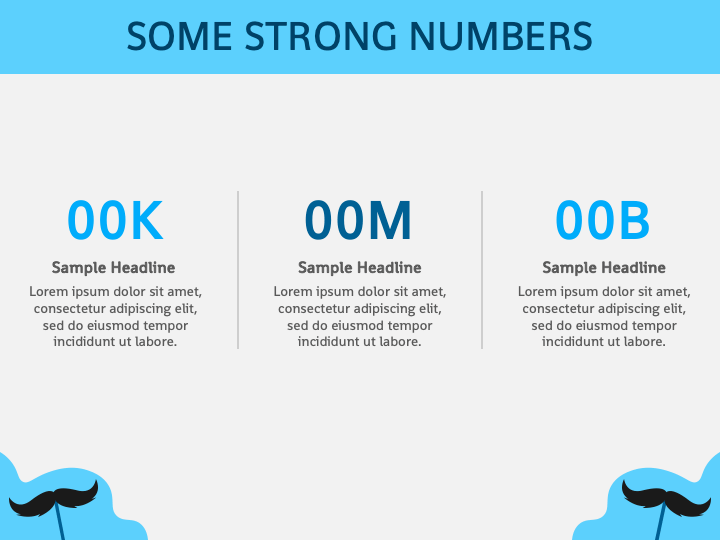
- Present the stats about men across various aspects, such as leading causes of death among men, the comparison of men and women holding leadership positions, and more, using a stats layout.
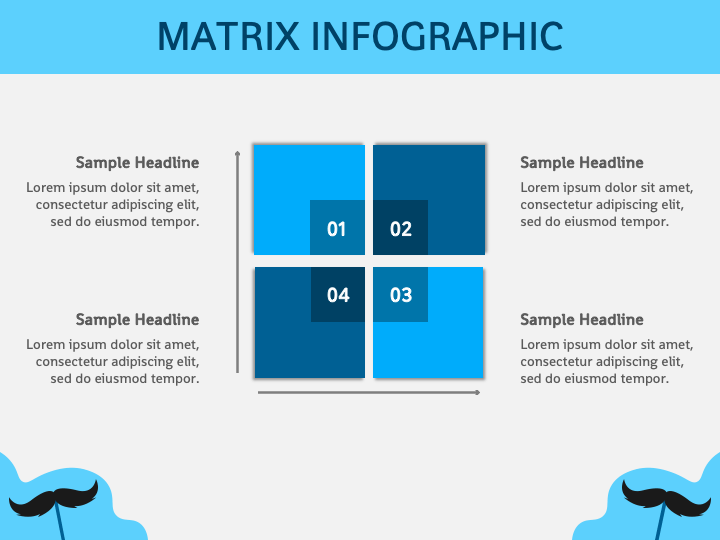
- Showcase various dimensions of men’s experiences and societal roles via a 2*2 matrix infographic.
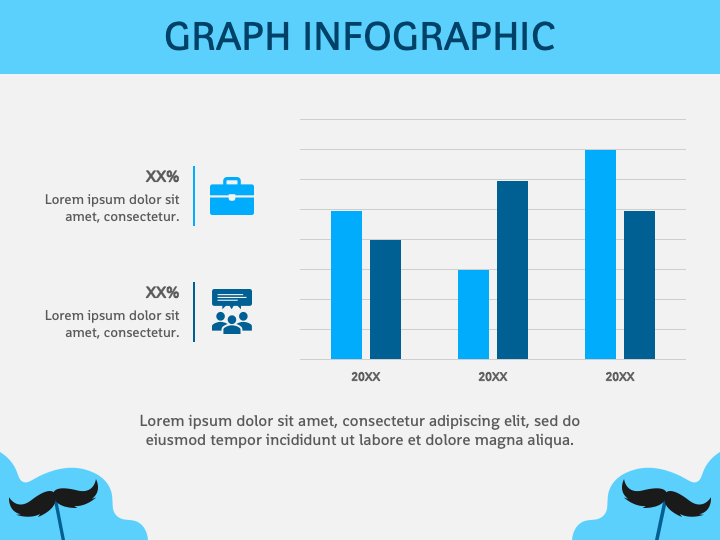
- Illustrate the comparison of average life expectancy between men and women, the time spent on childcare activities by fathers and mothers, the prevalence of depression and anxiety disorders between males and females, etc., through a bar graph.
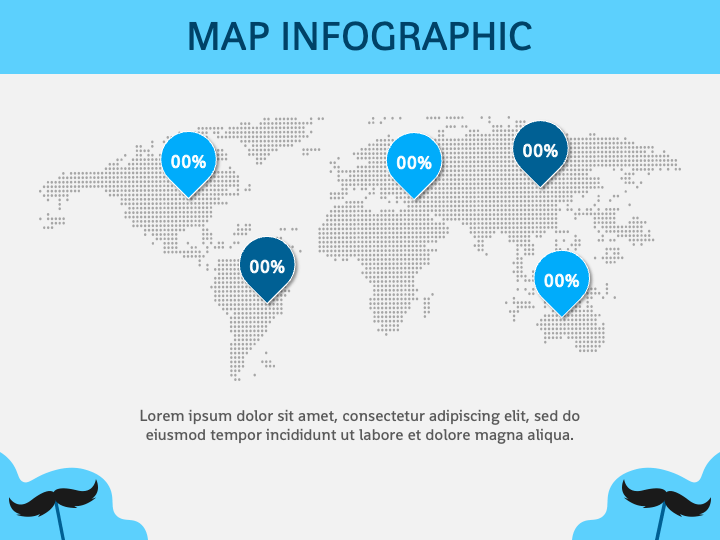
- Present the experiences of men from different parts of the world based on various factors via a map diagram.
- A ‘Thank You’ slide is provided to help you convey an appreciation message for the audience’s interest throughout the presentation.
Features
- Fuss-free editing
- High-resolution graphics
- Copyright-free
- 24/7 customer support
Download this PPT to elevate your presentation!