
RAG Dashboard for PowerPoint and Google Slides
(4 Editable Slides)

RAG Dashboard for PowerPoint and Google Slides

SB3380
Available For


Similar Products
- Sale

- Sale
Basic Project Management Process PowerPoint and Google Slides Template
(7 Editable Slides)
- Sale
- Sale
- Sale
Project Management Methodology PowerPoint and Google Slides Template
(12 Editable Slides)
- Sale


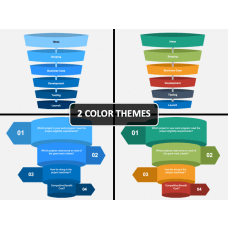
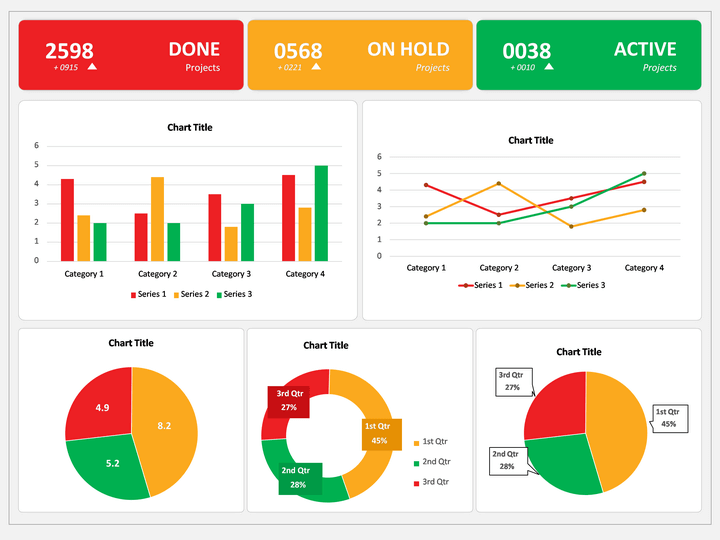
The RAG Dashboard is widely used in project management to show the status of the tasks. The RAG stands Red, Amber, and Green.
The professionally-designed and data-driven RAG Dashboard PowerPoint template consists of multiple slides that feature beautiful infographics. This easy-to-customize deck helps project managers highlight important information related to ongoing projects.
Our experienced designers have used bright color combinations in the template to give a distinguished look to each data. The graphics have been designed using PowerPoint objects, ensuring high optical quality even on large screens. Therefore, download the PPT now and share all crucial aspects of the project with your team in a visually engaging manner.
Useful Deck Serving Multiple Purposes
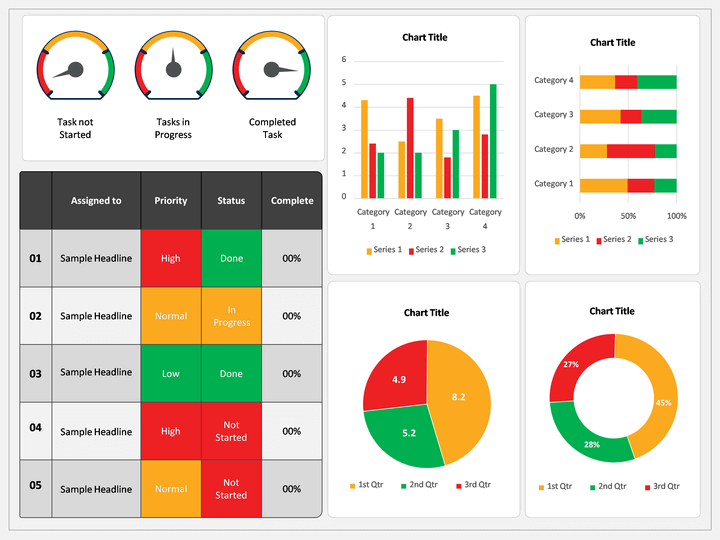
We have incorporated creative infographics like the speedometer, chart, histogram, and many others to help you illustrate the data without much text. With the help of the set, you can showcase:
- the project status update
- how well the project is performing
- KPIs relevant to each milestone or process
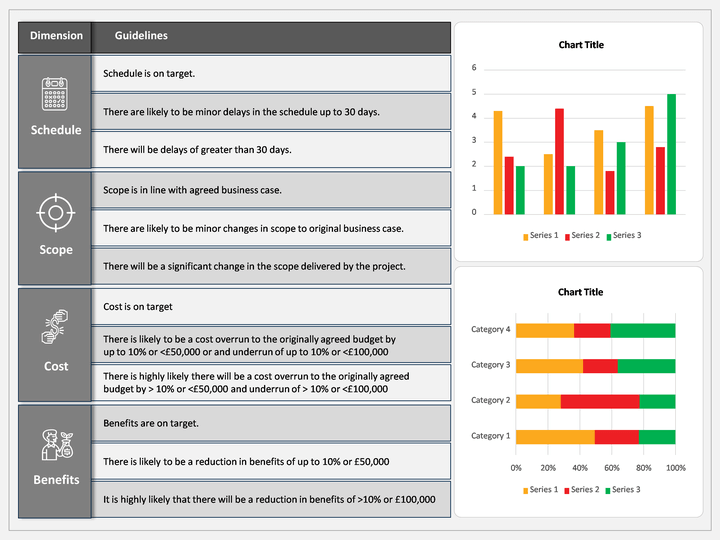
- project scope, risks, assumptions, issues, and dependencies
- the number of completed, running, and not started projects, and much more
So, don’t delay in getting this PPT. Download it now!
Salient Features
To ensure high quality, we have designed the slides very precisely and adorned them with the following features:
- You can download it for widescreen as we have crafted it in a 16:9 aspect ratio.
- What you will like the most about it is, you can modify it completely the way you want, without any technical skill or editing experience.
- The graphics are HD and vector-based that enable you to resize them without worrying about the resolution as it will remain intact.
- Since the design is data-driven; you only need to change the values, the graph will change automatically.
- We have also provided infographic version of the same slides in case you don’t want data driven charts.
Download the RAG Dashboard PPT instantly and use it for many other presentations without re-downloading!
Write Your Own Review

Related Products

