Funnel Diagram for PowerPoint and Google Slides
(9 Editable Slides)
Funnel Diagram for PowerPoint and Google Slides
Available For
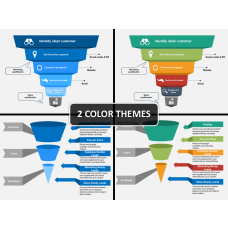
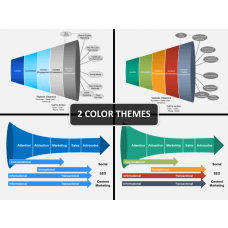
Being an important tool for depicting various stages of sales process, a pre-designed PowerPoint Funnel Diagram Template will help you communicate your message most effectively. Professionally made, each of the slides in the set gives you complete customization option. Thus, you can mold them just the way you want. As you get glossiest and most stylish of the layouts you don't just have the ease of communicating but also of being incredible! You get absolutely out-of-the-box method to present your ideas.
From explaining the periodic target to your team to telling about the conversion rate you look up to, you are always clear at conveying your message. Another best thing about the template is that it is completely versatile. This makes it truly useful for you regardless of your industry type or presentation purpose. From telling your team-members about your plans and strategies to proposing them to come up with their ideas, it fits every purpose. The slides are instantly downloadable and ready-to-use once you download them. This means, you spend just a few minutes in including them in your visuals.
When you will save all your efforts, time and resources, you will have more time for other important things. Being completely editable, you can change the color and other designing elements and even the placement of the text. Even the formatting isn't a headache for you. You are free from all the burdensome tasks. Within minutes and with no complicated efforts, you get ready to impress your audience at best!
About
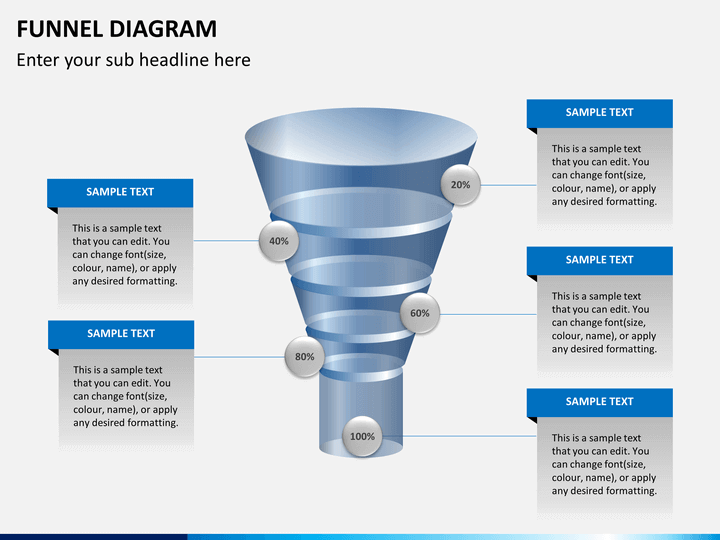
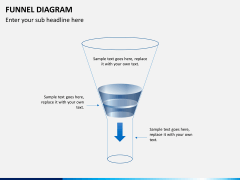
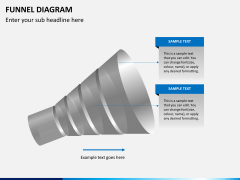
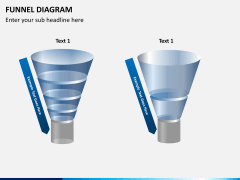
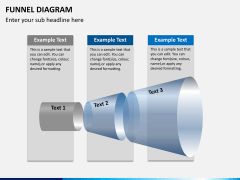
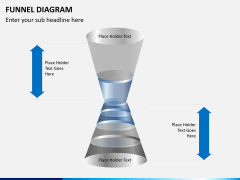
Funnel Diagram is a kind of diagram that displays values in their steadily decreasing degrees. In other words, it depicts the progressive reduction taking place in the data when it passes through several phases one after another. It is the best way to demonstrate a process that can said to be starting at 100% but ending with noticeable lowering in the amount or percentage in steps or stages finally falling down to the minimum. It is a popular tool for measuring the efficiency of sales and marketing strategies and processes.
Often used for representing the various stages of a sales process, It also works best in recognizing the rate at which fall out is taking place. Most sales managers use it for visualizing the sales conversion data. This may start with entire target market keeping to the 100% and move down to who really purchased your product or services and the real profit that you made in the process. This way you get to evaluate how much conversion actually took place and who slipped out and at what stages.

