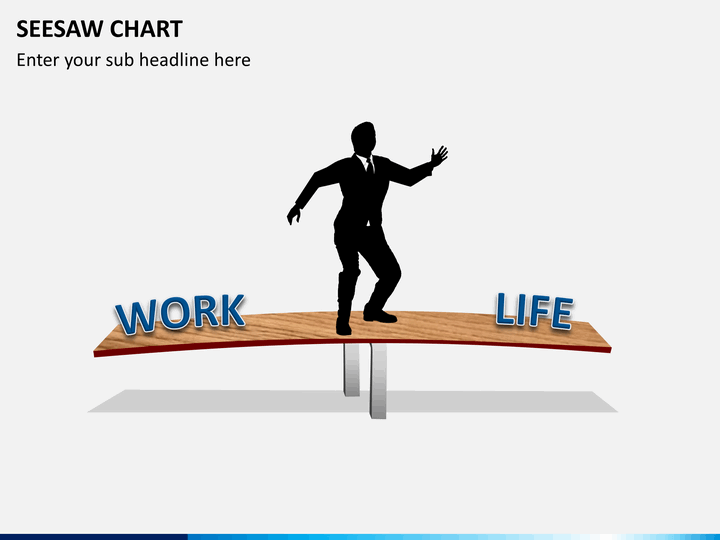
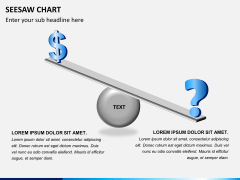
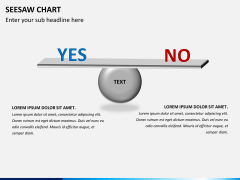
Our Seesaw Chart PowerPoint Template contains 7 editable slides which can be instantly edited according to your requirements. This template set can be used to give presentations in which two entities or aspects are compared with each other.
The set contains attractive graphics and ready to edit slides so that you only have to focus upon your presentation rather than spending time in creating attractive presentation. The 7 slides used in the template set have been designed by our experts to save your time and energy and keeping you up to the task of the content creation for the presentation.
This set can be used to give a short and compact presentation in which entities are compared. Add your content in the vibrantly colored text boxes and give an awe-inspiring presentation to your audience. The simplicity of this template is it's most enticing feature because it conveys your message to your audience with ease and simplicity, meanwhile keeping the central idea of your presentation intact. You will be surely applauded after giving a presentation with this amazingly designed Seesaw Chart template.
About
Seesaw Charts are used to demonstrate the comparison between two objects or entities and to outline their pros and cons. It is an effective and easy way to present the possible outcomes and differences between two objects by highlighting their qualities and inferences upon the desired actions. These comparisons are an easy way to explain people about profits and losses about any system or process. An important utility in the field of corporate planning and management.

