

Bar Chart PowerPoint Template
Bar Chart PowerPoint Template
(8 Editable PowerPoint Slides)
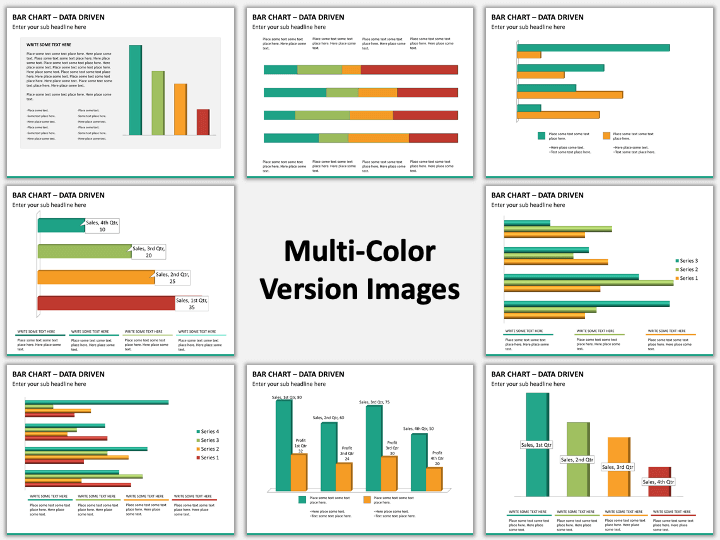
(8 Editable PowerPoint Slides)
Related Presentation Templates
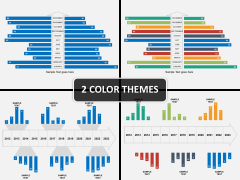

Being one of the simplest known methods for depicting statistical data, it is often used in business presentations for illustrating information in effective manner. But when it comes to design the visuals on your own, it no more remains a simple thing to do. This is why, we bring to you professionally crafted pre-designed PowerPoint Bar Chart Template. This will not only disburden you from hectic slide creation but will also let you visualize your data in exceptionally attractive way.
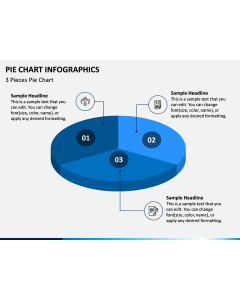
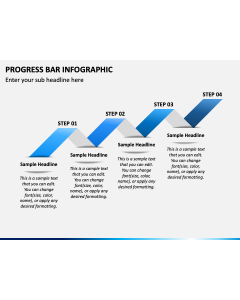
From displaying the monthly sales figures to presenting the quarterly profits of your company, you are going to be fabulous with the template. As the slides are versatile and really flexible, you don't have to worry about how fitting they will be with your subject matter. In fact, they are going to be in sync with anything and everything you decide to illustrate to your audience. You may focus on financial results or on the investment stats. It can be the analysis of some periodic data or a quick comparison of figures. Whatever it will be, you will be incredibly comprehensible! Your points of arguments will be clear and crisp. Your visuals will say it more than your words. And you will be highly impressive.
With complete customization option, you can edit every single design element. At the same time, the editing process will be superbly quick and easy. You will hardly take any time in adding your content. And you will be doing it just the way it fits your purpose. So, your presentation will be ready quicker than ever! You will be leaving an ever lasting impression on your audiences without any unnecessary struggle. Above all, it will be just perfect.
About
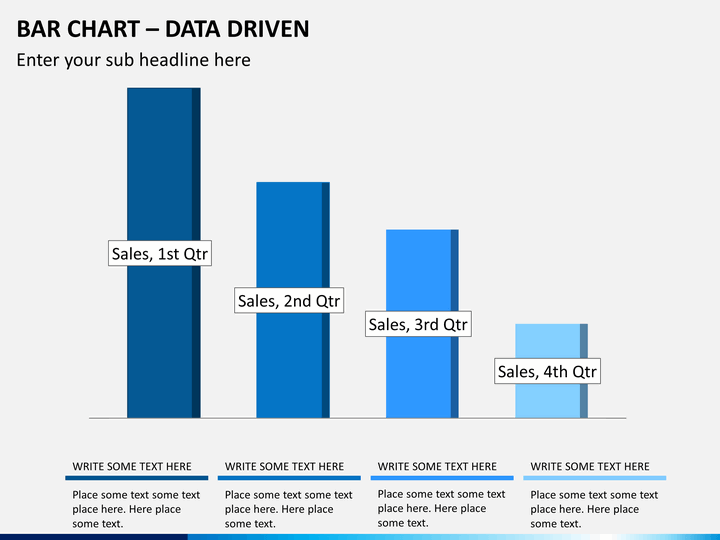
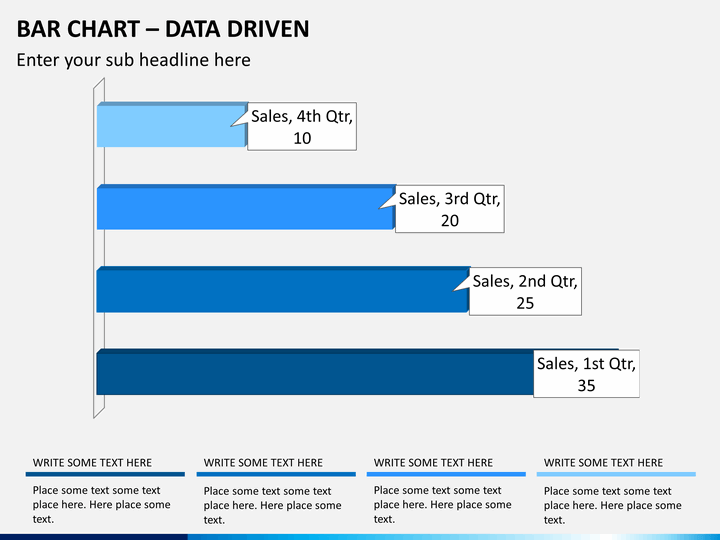
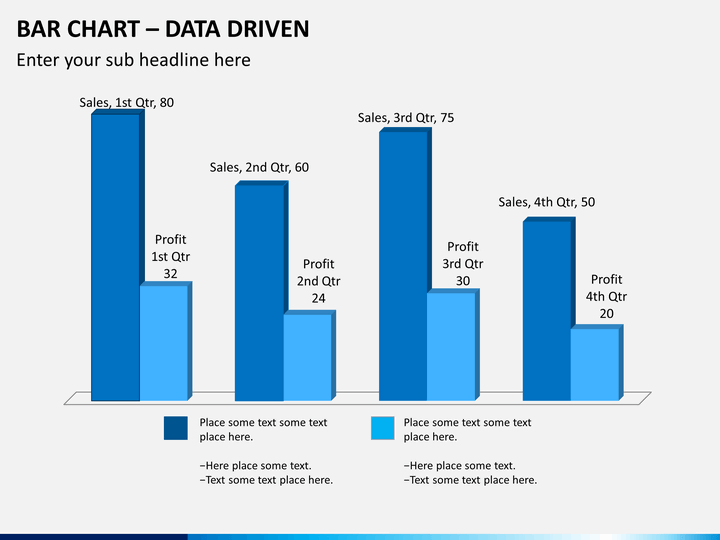
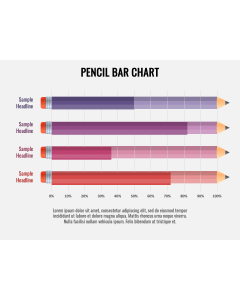
Bar Chart is one of the best ways to visualize any data changes taking place over a specific amount of time as well as for displaying the observations based on certain conditions and for making comparison among various components. It is best used in dealing with statistical data and is much loved by technical analysts.
It usually organizes the categories by the vertical axis and values by the horizontal axis along with the bar lengths that are proportional to the values they are representing.
It is often used for visual representation of price activities taking place over a particular period of time as well as for spotting out trends and patterns of sales, investment, and financial market in terms of security trading.