10 Column Table
10 Column Table
(1 Editable Slide)
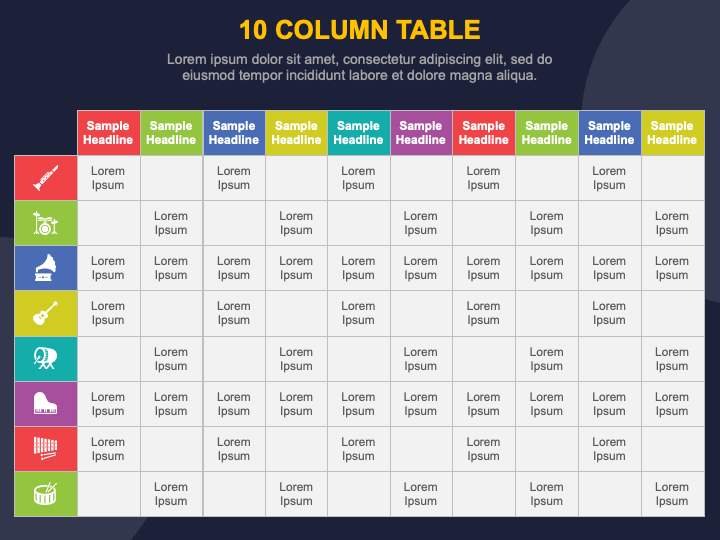


Download our 10 Column Table presentation graphic for PowerPoint and Google Slides to showcase complex information in a structured manner and ensure maximum comprehension. The slide comprises a tabular illustration with editable text placeholders.
This infographic is the best pick to highlight a comparative overview of products, services, or concepts based on various factors and attributes. Project managers can leverage this versatile layout to depict the breakdown of the project’s goal into milestones, along with start and end dates, priorities, roles and responsibilities of different teams, etc. Financial experts can illustrate a financial summary of a specific period. Educators can incorporate this PPT into their presentations to display lesson planning, including lesson topics, learning objectives, teaching aids, teaching strategies, and more.
Features
- Resizing and recoloring the graphic to match your presentation’s theme is effortless.
- The visual maintains consistent quality, irrespective of screen size.
- Our designers have thoughtfully created this illustration to ensure it complies with copyright regulations.
Get this PPT now to equip your presentations with dynamism and elegance!