11 Row Table
11 Row Table
(1 Editable Slide)
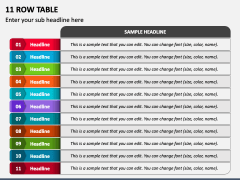
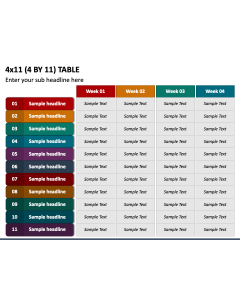
Download our 11 Row Table presentation graphic for PowerPoint and Google Slides to break up text-heavy slides and present a large piece of information in well-summarized points. The slide features a tabular infographic with entirely editable cells to accommodate your content.
Project managers can leverage this graphic to showcase project objectives, milestones, roles and responsibilities of team members, things to consider in each task, and more. Market analysts can use this visual aid in their market research presentations to portray market size, customer demographics, competition, and other variables. Product managers can show each feature of the product in detail.
Features
- Modifying the illustration to fit your needs doesn’t require specialized skills or external aid.
- Each object is crafted only after thorough research to eliminate the room for copyright violations.
- Our customer service team is available 24/7 to provide you with the assistance you need.
- The graphic’s quality remains unchanged, even when displayed on a bigger screen.
Make room for this versatile graphic in your slideshows to draw your audience’s attention and help them quickly process the information!

