

2 Columns 7 Rows for PowerPoint and Google Slides
2 Columns 7 Rows for PowerPoint and Google Slides
(1 Editable Slide)
Related Presentation Templates
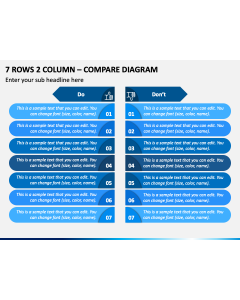
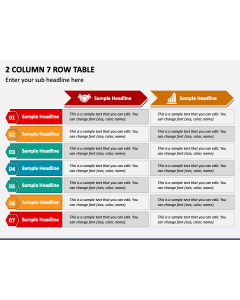

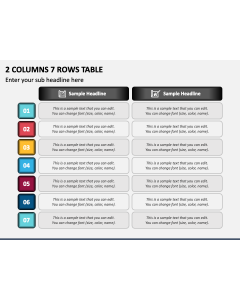
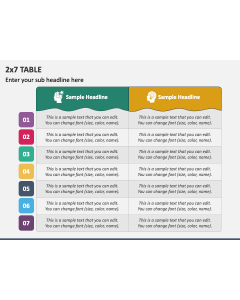
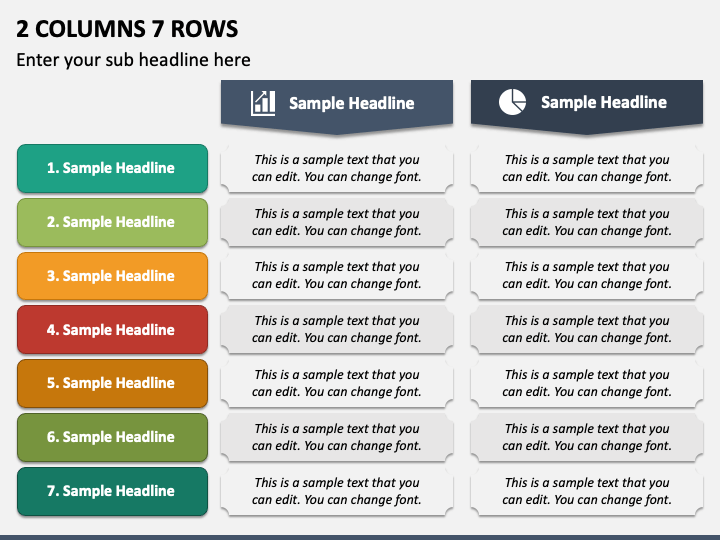
Download our 2 Columns 7 Rows presentation graphic for PowerPoint and Google Slides to display your information in a structured and organized way, making it easy for your audience to comprehend key takeaways. The slide features a versatile tabular graphic that professionals from different fields can use according to their preferences. Business development managers and sales professionals can present the comparison of two products or services based on several parameters.
Strategists can visualize the side-by-side comparison of two available options to deal with a problem, implement a framework, etc., helping the stakeholders make an informed decision. Further, you can portray business goals and objectives, different marketing channels and their effectiveness, pricing plans, target audience demographics, and more.
Excellent Features
- You can customize the graphic without investing much time or effort.
- The resolution of the infographic will remain constant, even when projected on a widescreen.
- The users won’t encounter copyright violation issues, as the graphic has been carefully designed from scratch.
- Once downloaded, you can use this PPT for a lifetime.
Give your presentation a structured look with this multi-use slide; get it now!