

2 Stage Semi Circle for PowerPoint and Google Slides
2 Stage Semi Circle for PowerPoint and Google Slides
(1 Editable Slide)
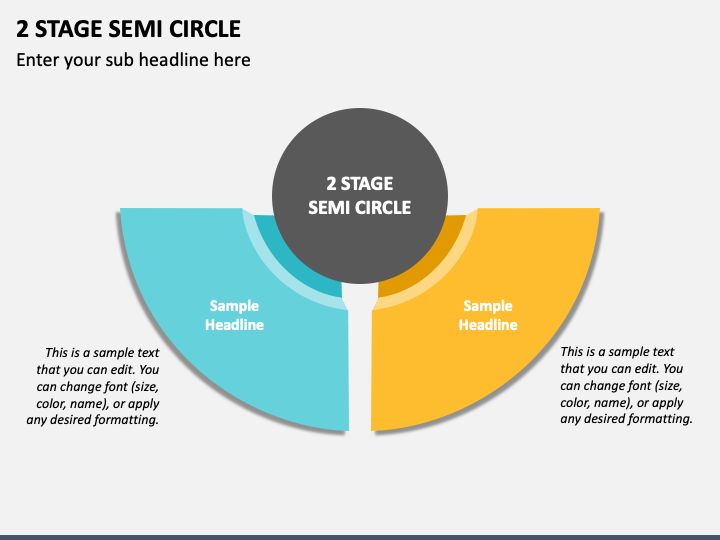

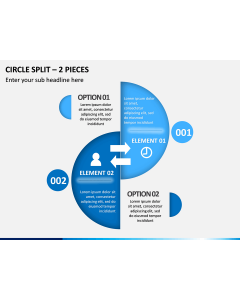
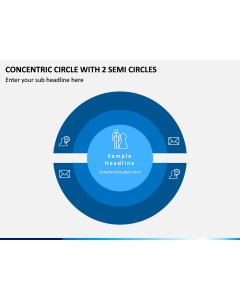
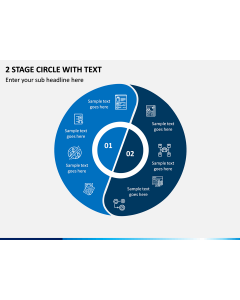
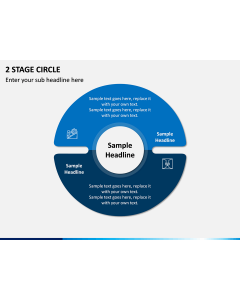
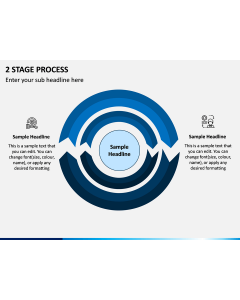
Get your hands on our 2 Stage Semi-Circle slide for MS PowerPoint and Google Slides to spruce up your presentations and add a visual dimension to your content. It comprises a colorful semi-circle segregated into two parts with enough space for text insertion.
Strategists can leverage this infographic to showcase the similarities and differences between the two sets of data, such as products, services, and processes. Business and market analysts can use this infographic to illustrate the market share of two different companies or brands, including the strengths and weaknesses of each, and provide insight into the competitive landscape. Further, finance experts can use this visual to highlight the breakdown of the company’s budget and comparison of two different categories, such as spending on marketing vs. expenditures for operations.
Impressive Features
- Our customer support professionals are available 24/7 to address your concerns at the earliest.
- The illustration is easily adaptable to your preferences without any hassle.
- Each object is designed carefully from scratch to avoid copyright issues.
- Even on larger screens, this vector-based infographic maintains the same resolution.
Incorporate this visual into your presentations to make your content more engaging and captivate your audience!