

3 3D Concentric Circles for PowerPoint and Google Slides
3 3D Concentric Circles for PowerPoint and Google Slides
(1 Editable Slide)
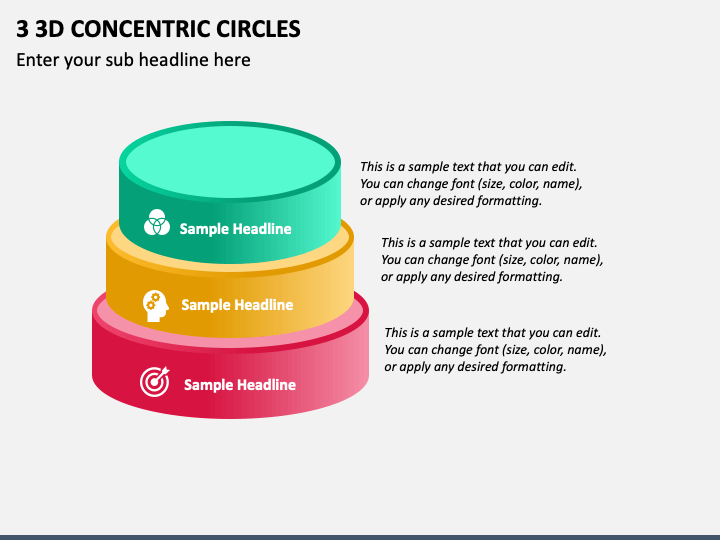
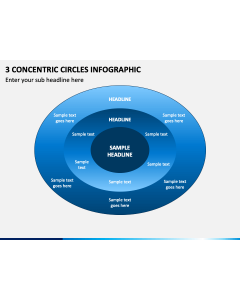
Lay your hands on our 3 3D Concentric Circles slide for MS PowerPoint and Google Slides to showcase your complex textual information in well-summarized points and make it easy for the audience to retain key takeaways for longer. The slide features three-dimensional concentric circles with ample space to insert relevant text.
Business and market analysts can use this multipurpose infographic in their presentations to showcase the relationship between different business units, products, or customer segments. Additionally, this diagram can be used to depict the relative size of different markets, the importance of various factors in the decision-making process, and more. You can also showcase different management levels of your organization.
Excellent Features
- The illustration can be easily customized to suit your preferences.
- Our designers have crafted this illustration with utmost precision and care to ensure no user experiences copyright issues.
- The graphic can be projected on any screen size without losing quality.
- Our dedicated customer support team is available round the clock to answer your questions promptly.
Download this PPT to capitalize on the stunning graphic for adding depth and interest to your presentations!