

3 by 10 Table Matrix
3 by 10 Table Matrix
(1 Editable Slide)
Product Details
(1 Editable Slide)
Available For
PowerPoint
Keynote
Google Slides
Canva Slides
Animation:
Yes
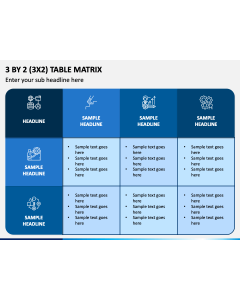
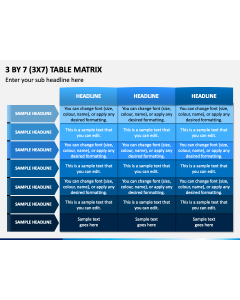
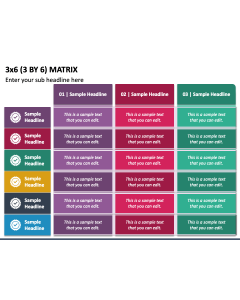


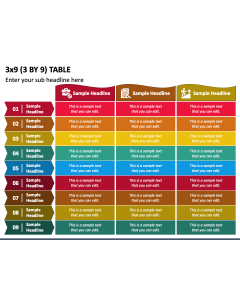
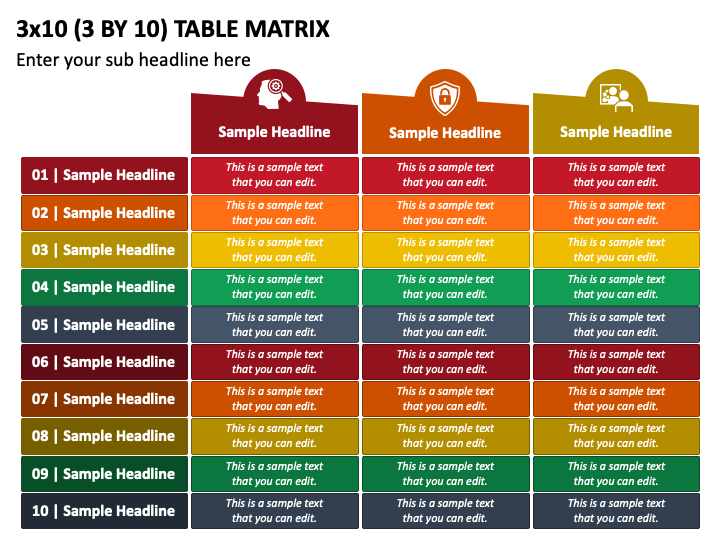
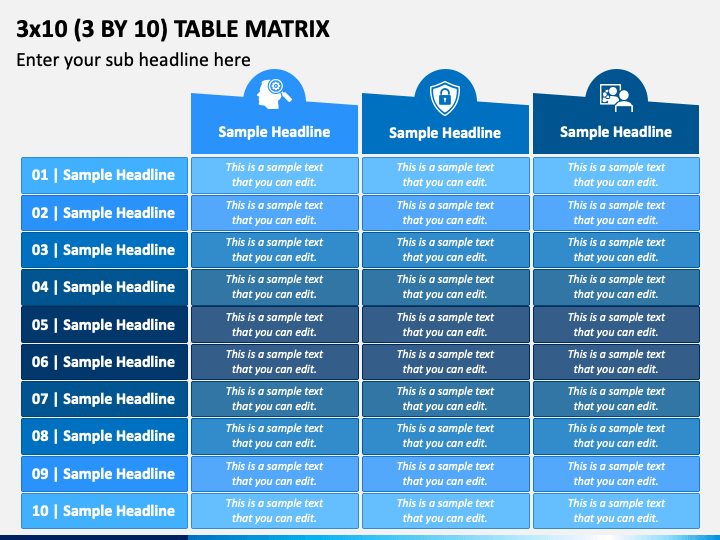
Grab our 3 By 10 Table Matrix PPT to give your text a visual appeal and retain your audience’s sight throughout the slideshow. The PowerPoint slide is equipped with a colorful tabular infographic of three columns and ten rows. Business development executives can showcase a comparative overview of product and service offerings of the same category based on various parameters. You can also capitalize on this illustration to exhibit the comparison of frameworks, strategies, and approaches in a crystal clear manner.
Salient Features
- The users won’t confront challenges while modifying the illustration as per their preferences.
- No user will experience copyright issues, as the entire slide has been designed from scratch.
- The visual offers an uninterrupted resolution on all dimensions.
Make this PowerPoint slide yours to enrich your presentations!