4 Square Venn Diagram
4 Square Venn Diagram
(1 Editable Slide)
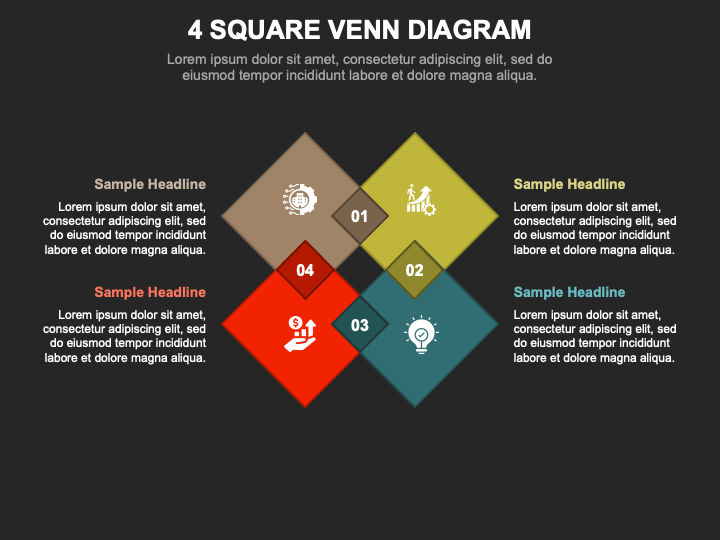


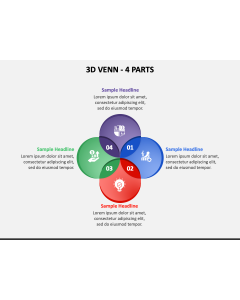
Get your hands on our 4 Square Venn Diagram for PowerPoint and Google Slides to give your presentations a compelling look and make your content stand out. The slide features an infographic of quadrilateral-shaped boxes overlapping each other and adorned with appealing icons. The visuals are curated with subtle color contrasts and editable text placeholders.
With this illustration, business analysts can highlight the SWOT analysis of the organization. Marketing professionals can visualize the four Ps of marketing. Business development experts can portray similar and dissimilar features and characteristics of products or services of various brands. Furthermore, you can display the relationships, comparisons, and intersections between different categories of data.
Features
- Our support staff is accessible around the clock to resolve your queries instantly.
- The high-resolution design elements ensure uninterrupted visualization on all screen dimensions.
- You get complete freedom to customize the set attributes.
Download this PPT to enhance your message’s effectiveness!