

4x7 Table for PowerPoint and Google Slides
4x7 Table for PowerPoint and Google Slides
(1 Editable Slide)
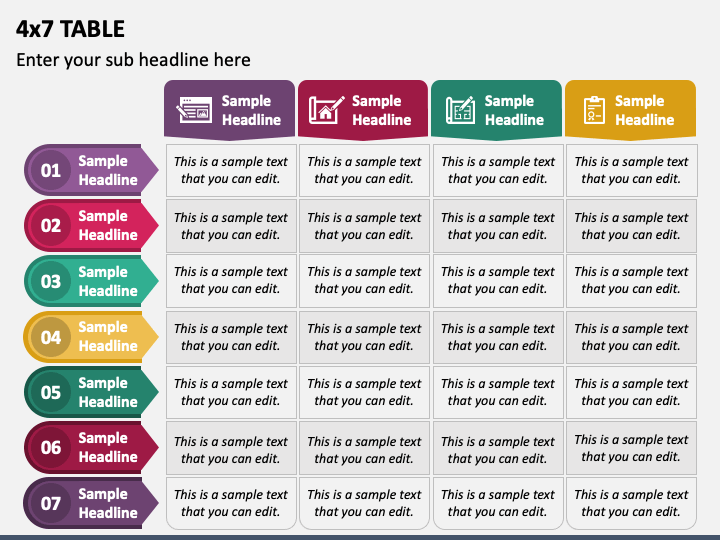

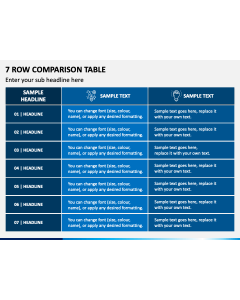
Lay your hands on our 4x7 Table presentation graphic for PowerPoint and Google Slides to organize data in a clear and concise manner. Department heads and finance managers can use this visual to represent the breakdown of expenses for the upcoming quarter. Social media managers can highlight customer engagement on different social media channels over a period of time. Using this table, product managers can showcase the comparison between the features of different products and services of the same niche.
The PPT depicts a table with 4 columns and 7 rows adorned with serial numbers and eye-pleasing icons in vibrant color tones. This stunning visual aid will enable your audience to understand the content quickly. You can download this impressive slide now to get lifetime ownership!
Distinct Features
- You can edit the infographic effortlessly without any technical assistance or editing knowledge.
- Presenting the graphic on a large screen will not affect the quality and resolution.
- Our team has designed the slide after conducting in-depth research to avoid copyright issues.
- If you encounter any technical problems, you can instantly contact our qualified customer care executives for assistance.