

5 by 6 Table
5 by 6 Table
(1 Editable Slide)
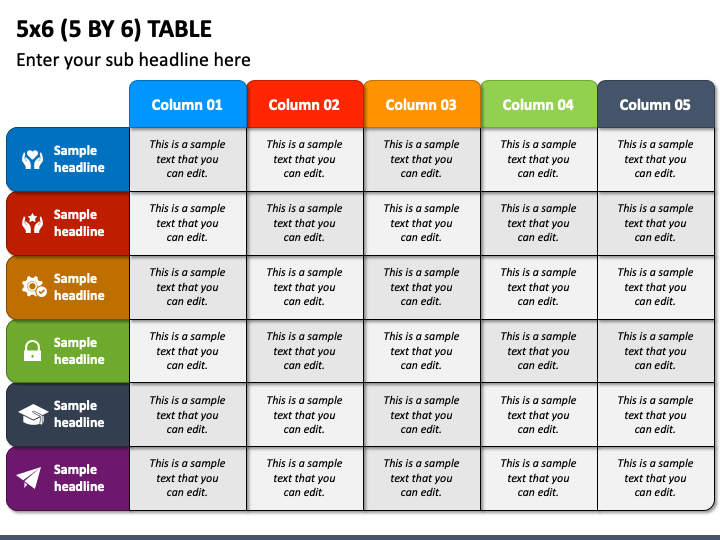
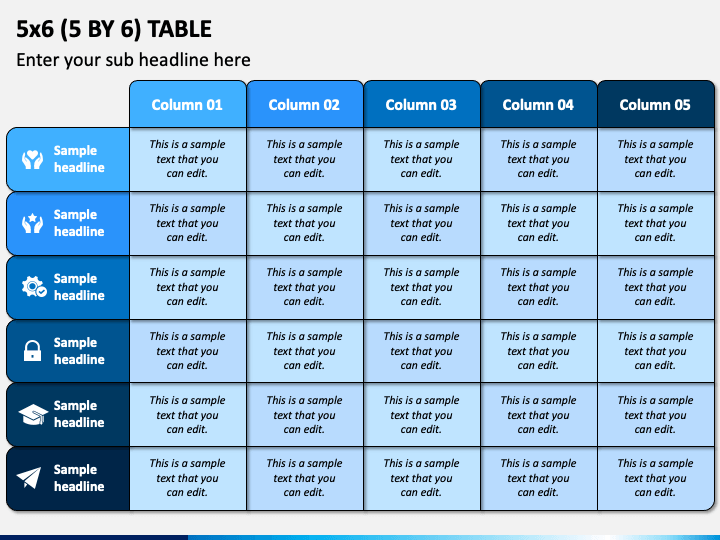
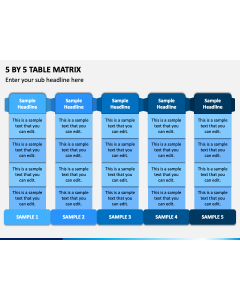
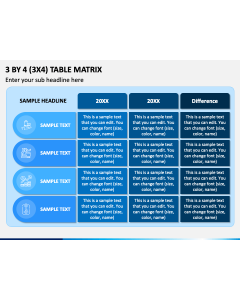
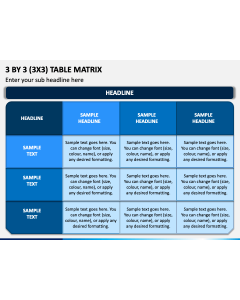
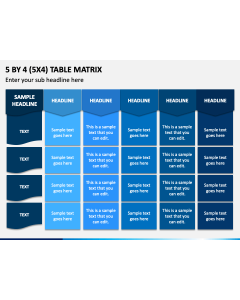
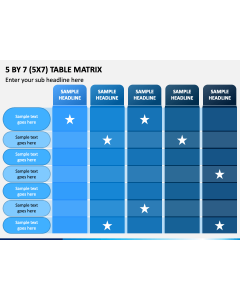
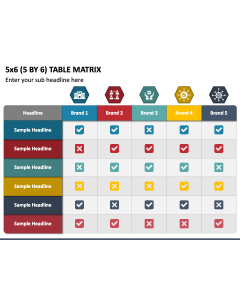
Use our 5 By 6 Table PPT to visualize the weekly to-do list, key features of a project, the progress status of different projects, and other information. The PowerPoint slide, featuring a colorful table infographic with five columns and six rows, is the perfect visual aid to represent the data clearly and concisely. Senior executives and business development managers can leverage this illustration to illustrate pricing plans, financial trends, product categories, competitive analysis, and more. Using this feature-rich slide, financial managers can depict the financial projections for a specific period. HR managers can also use this infographic to demonstrate the schedule of employee engagement activities.
Impressive Features
- Easy to edit; make the changes to suit your needs without comprehensive technical skills.
- You can present the vector-based visual to any screen size without impacting the quality.
- No room for copyright violation issues.
- Our customer support executives are available 24*7 to address all your concerns and queries.
So, download this PPT right away and deliver enthralling and meaningful presentations, leaving the audience enthralled!