

5 Column By 8 Row Table for PowerPoint and Google Slides
5 Column By 8 Row Table for PowerPoint and Google Slides
(1 Editable Slide)
Product Details
(1 Editable Slide)
Available For
PowerPoint
Keynote
Google Slides
Canva Slides
Animation:
Yes
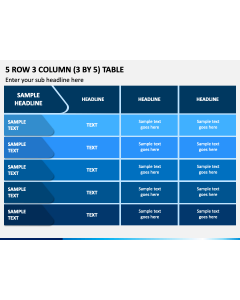
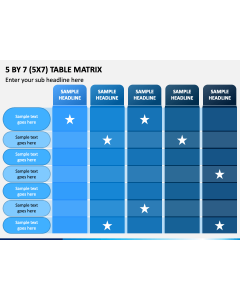
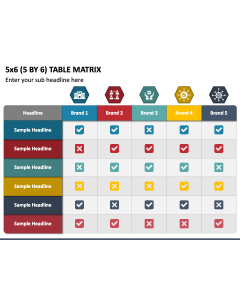
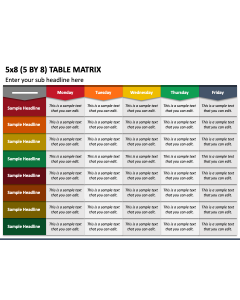
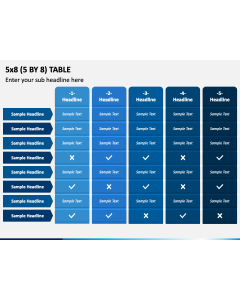
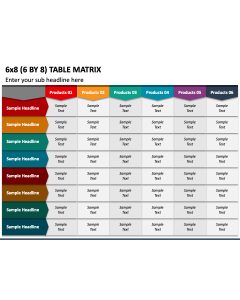
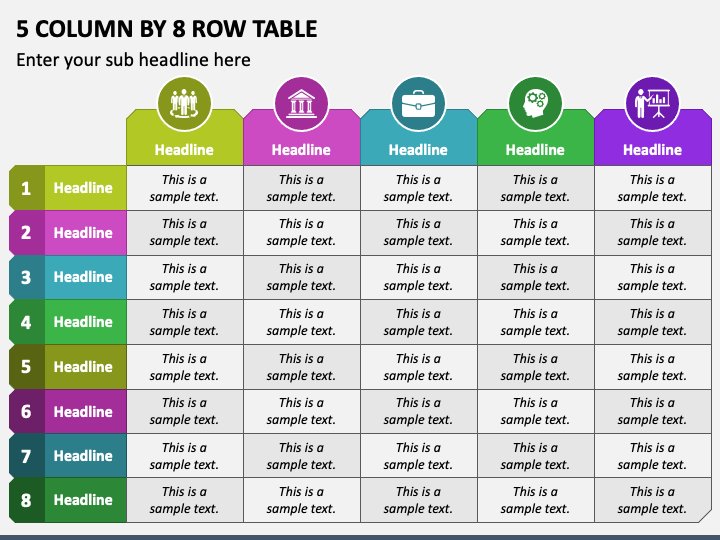
Download our sleek and modern 5 Column by 8 Row Table presentation slide for MS PowerPoint and Google Slides to showcase data and information in a simplified manner, without using too much text.
The slide features a versatile tabular illustration, perfect for researchers to portray the survey results. Warehouse managers can also make the most of this graphic to display inventory levels. Further, the multi-use table infographic can be used to highlight product comparisons, schedules or timelines of events, project status, etc.
Salient Features
- You can effortlessly customize the illustration to your liking.
- Each attribute of this infographic is unique; hence, the users won’t encounter copyright violation issues.
- You can display the graphic on any size screen without worrying about its quality.
- You can reach our customer support team anytime to get your queries resolved quickly.
Use this multipurpose infographic to boost your presentations!