

6 Row 3 Column for PowerPoint and Google Slides
6 Row 3 Column for PowerPoint and Google Slides
(1 Editable Slide)
Related Presentation Templates
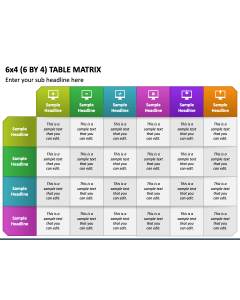
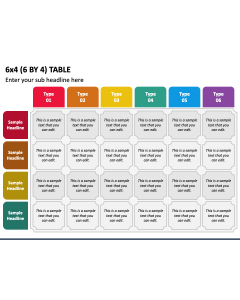
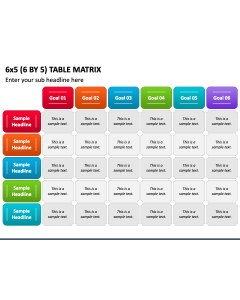
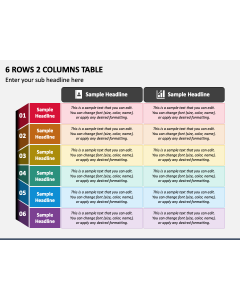
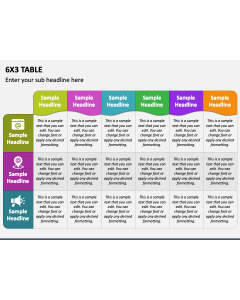
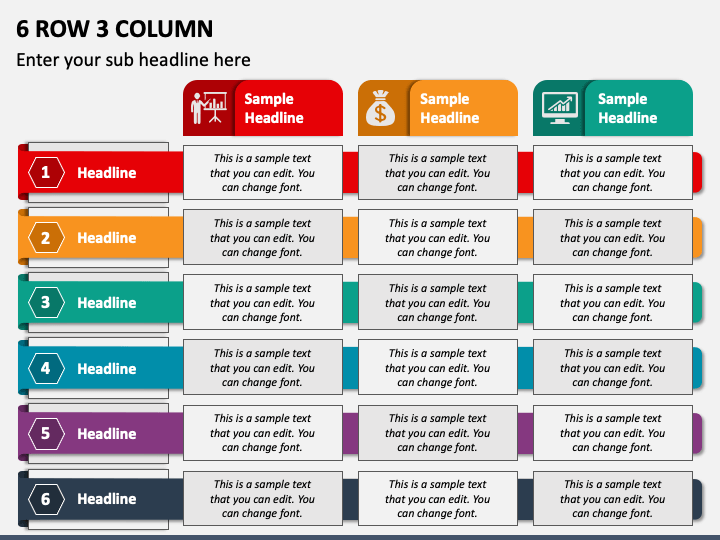
Make your information stand out and add visual interest to your boring presentations with our 6 Row 3 Column slide for Microsoft PowerPoint and Google Slides. It contains a tabular illustration of three columns and six rows with enough space to insert the desired text.
Sales professionals and financial analysts can leverage this illustration to highlight the data, such as monthly sales figures for different products and services, revenue generated from various business units, etc. Business development managers can capitalize on this illustration to depict the advantages of the company’s offerings compared to the competition. Further, you can portray the relationships between items, such as cause-and-effect relationships or dependencies.
Distinctive Features
- The illustration can be easily altered to meet your specific requirements.
- The visual quality doesn't get pixelated, even when projected on a larger screen.
- Our customer service representatives are available 24/7 to address your queries at the earliest.
- Once you download the PPT, you can use it without any restrictions or limitations.
Download this PPT now to take your presentation to the next level!