

Free - 7x6 Table for PowerPoint and Google Slides
Free - 7x6 Table for PowerPoint and Google Slides
(1 Editable Slide)
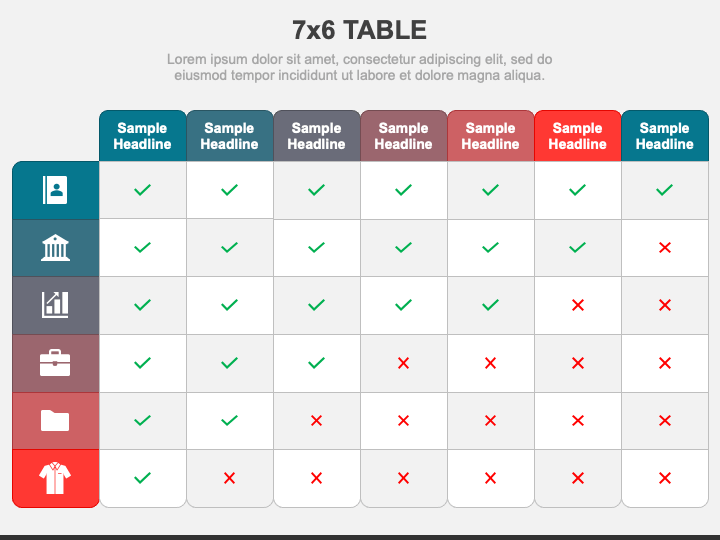
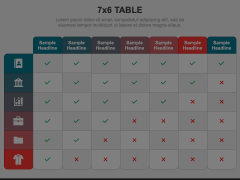
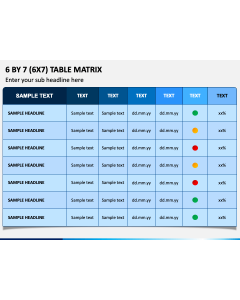
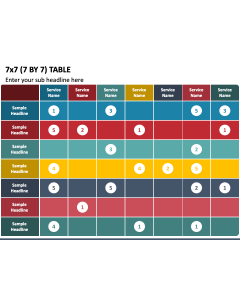
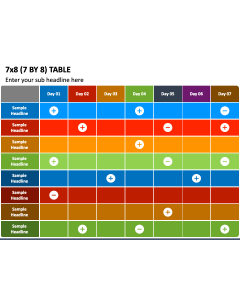
We have introduced the 7x6 Table graphic for PowerPoint and Google Slides to help you present your textual information in a clear and organized manner. The slide comprises a tabular illustration of seven columns and six rows with right and wrong tick marks.
This graphic is the perfect resource to depict a comprehensive comparative overview of the products and services of the same category based on specific features and attributes. Project managers can use this illustration to highlight the project status, achieved and missed targets, etc. Team leaders and industrial trainers can portray the key performance indicators of employees with the right checkmarks for exemplary performance and the wrong ones for areas needing improvement. Additionally, you can demonstrate the successful and underperforming marketing initiatives and campaigns.
Features
- Easy customization
- Assured high-resolution graphic
- Copyright-safe
- 24/7 accessible support
Make this PPT yours now!