8 Pieces Donut Chart Infographic
8 Pieces Donut Chart Infographic
(1 Editable Slide)
Product Details
(1 Editable Slide)
Available For
PowerPoint
Keynote
Google Slides
Animation:
Yes
Tags

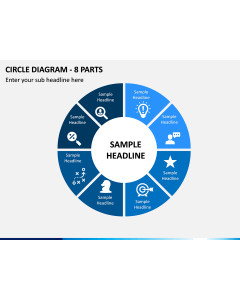

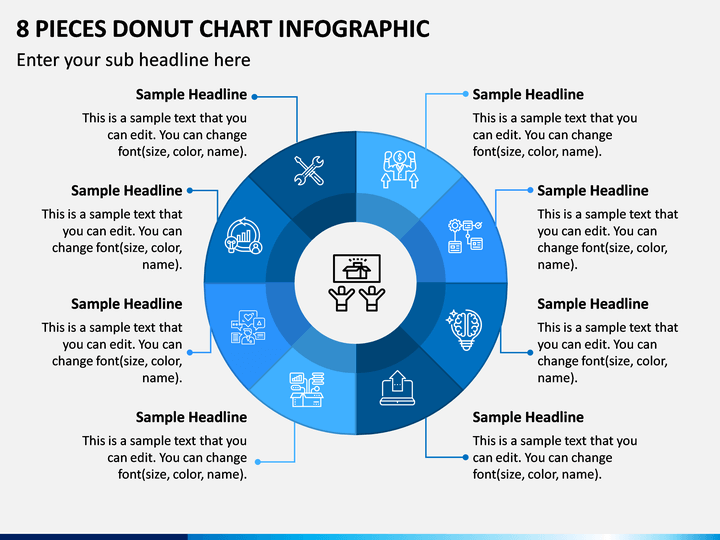
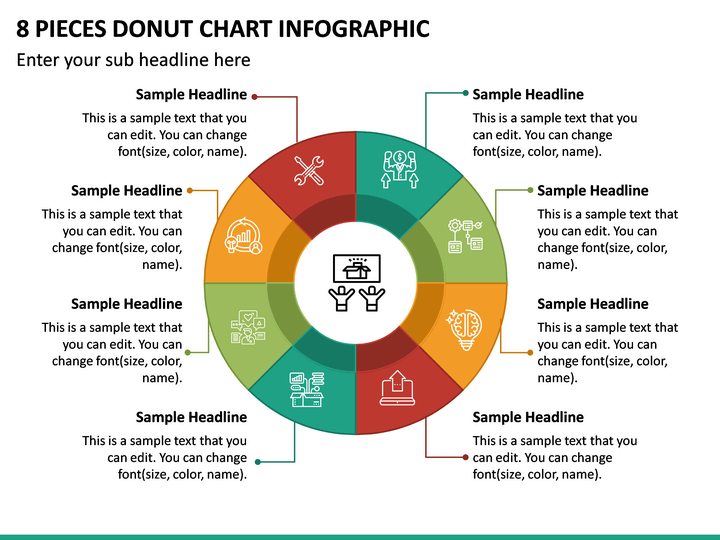
Grab our brilliantly crafted 8 Pieces Donut Chart Infographic PPT to present complex statistical data with clarity. Professionals from various domains can leverage this fully customizable slide to represent the relationship between two or more variables, the total number of data, survey results, multiple series, proportions of categorical data, business data reports, revenue by divisions, population segmentation, and much more.
The PowerPoint slide features a donut chart segmented into 8 pieces with eye-pleasing icons and text placeholders. So, download this impressive PPT today to let the viewers grasp your ideas quickly.
Key Features
- You can resize the infographic smoothly without losing resolution or optical quality.
- The graphic is 100% authentic and gives a unique appeal to your upcoming presentations.
- You can edit the element in just a few minutes without technical knowledge or editing experience.
Download this compelling slide now!