Bottleneck Diagram for PowerPoint and Google Slides
(6 Editable Slides)
Bottleneck Diagram for PowerPoint and Google Slides
Available For
Lay your hands on our Bottleneck Diagram for PowerPoint and Google Slides to add a touch of dynamism to your presentations and ensure easy comprehension of the presented information. Business analysts can use these graphics to illustrate common bottlenecks in a business and ways to address them for enhanced efficiency and productivity. Supply chain managers can display supply chain bottlenecks, such as transportation delays, inventory management issues, and production constraints. Sales and marketing experts can visualize the challenges in the sales funnel or marketing campaigns. IT professionals can depict the bottlenecks in the software development lifecycle. Additionally, you can use this deck to portray the significance of regular assessments and adjustments to ensure the business operates smoothly and efficiently.
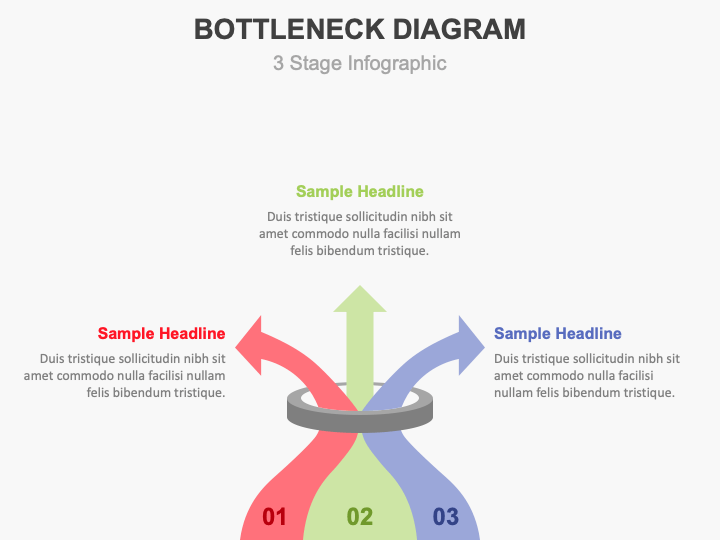
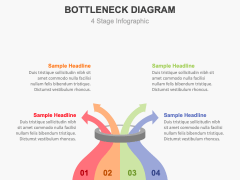
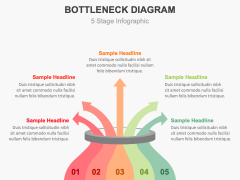
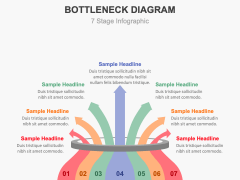
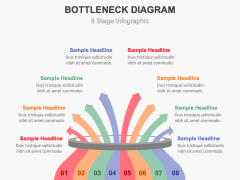
The slides comprise infographics depicting glass jars emitting colorful arrows. Each visual is adorned with editable boxes to insert the relevant textual information.
Features
- Regardless of technical proficiency, all users can make the desired changes without special tools or prior editing knowledge.
- Each visual ensures uninterrupted resolution, even when scaled to a widescreen.
- Our experienced designers have meticulously designed the set to prevent copyright issues.
Get this PPT to add a flair of creativity to your presentations!

