

Business Plan Infographics for PowerPoint and Google Slides
Business Plan Infographics for PowerPoint and Google Slides
(10 Editable Slides)


Related Presentation Templates

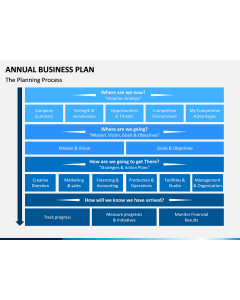
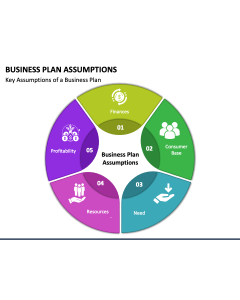

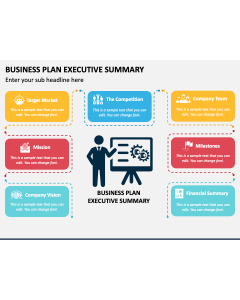


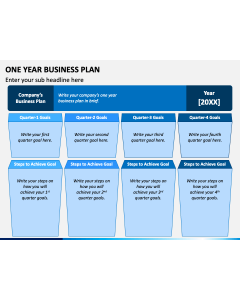
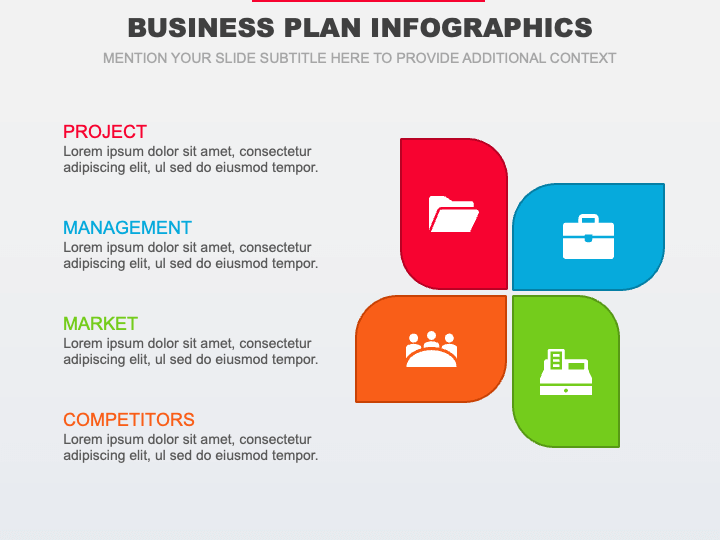
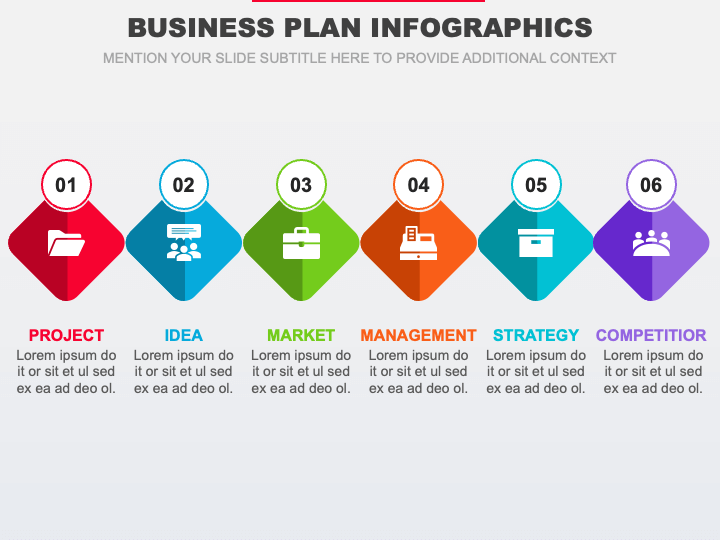
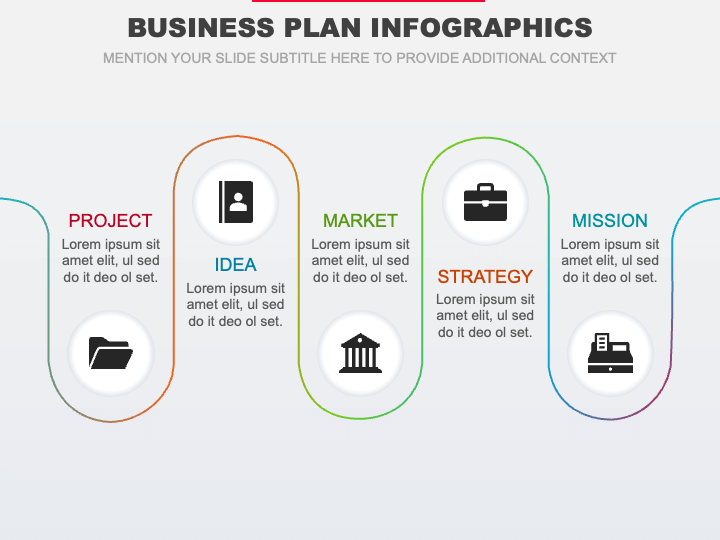
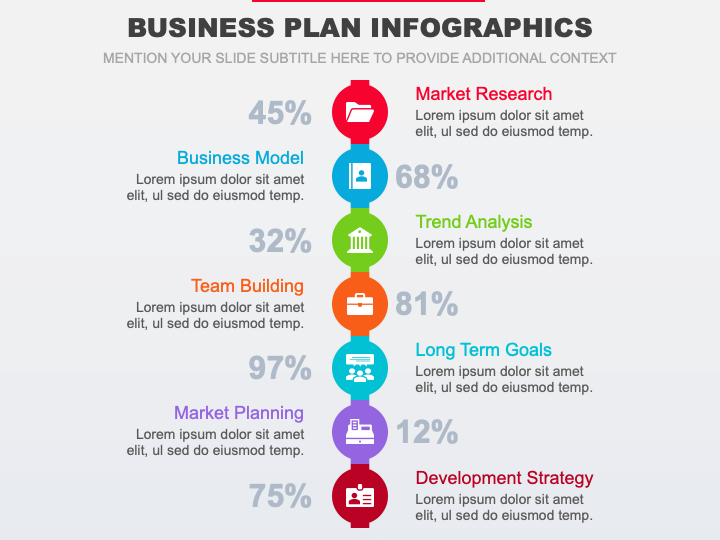
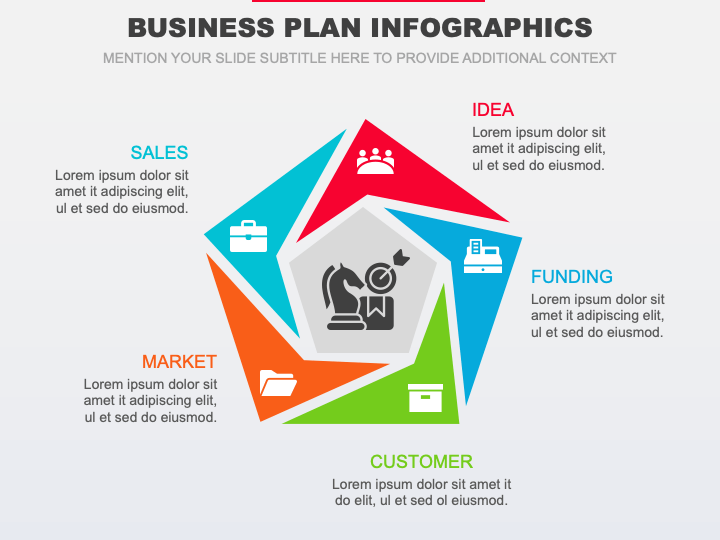
Leverage our Business Plan Infographics for PowerPoint and Google Slides to showcase various aspects of a business plan in a visually engaging manner. Senior executives and entrepreneurs can use these visuals to display key highlights of their business plan, including the mission statement, target market, unique selling propositions, and financial projections. Consultants can use these illustrations to depict a SWOT analysis of the business and industry, aiding in strategic decision-making. Financial experts can illustrate revenue forecasts, expense breakdowns, profit margins, cash flow projections, and ROI. Market and business analysts can showcase market size, trends, customer demographics, competitors’ analysis, and potential growth opportunities.
Sales professionals can showcase sales objectives and tactics to acquire a large customer base, retain existing customers, etc. Marketers can display marketing objectives, promotional channels, and budget allocation. Risk managers can also present their incident response plan and strategies to identify and manage potential risks.
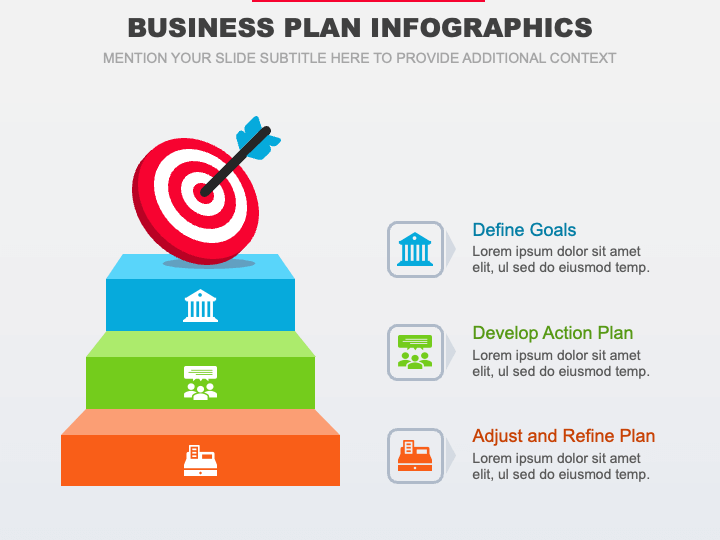
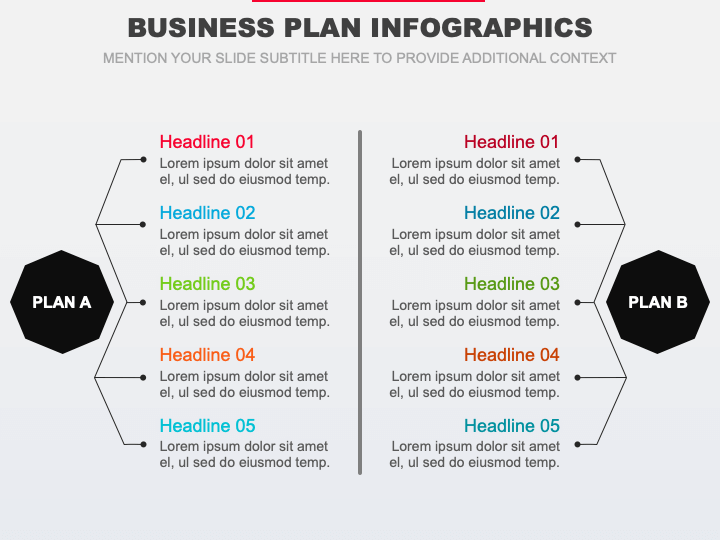
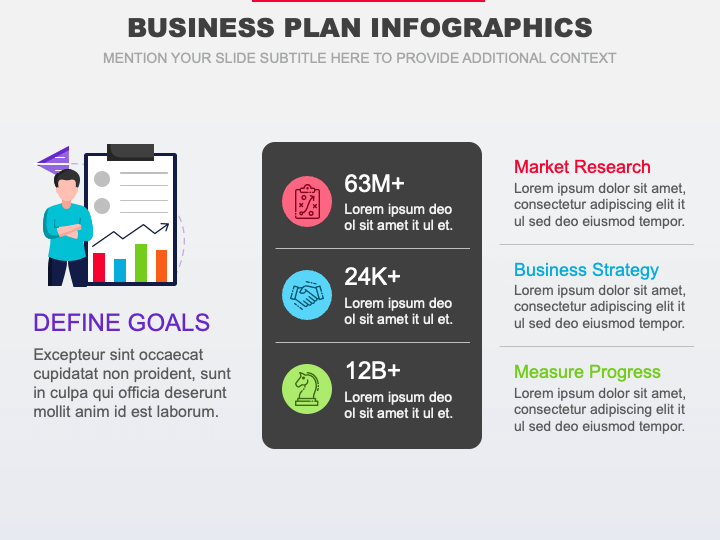
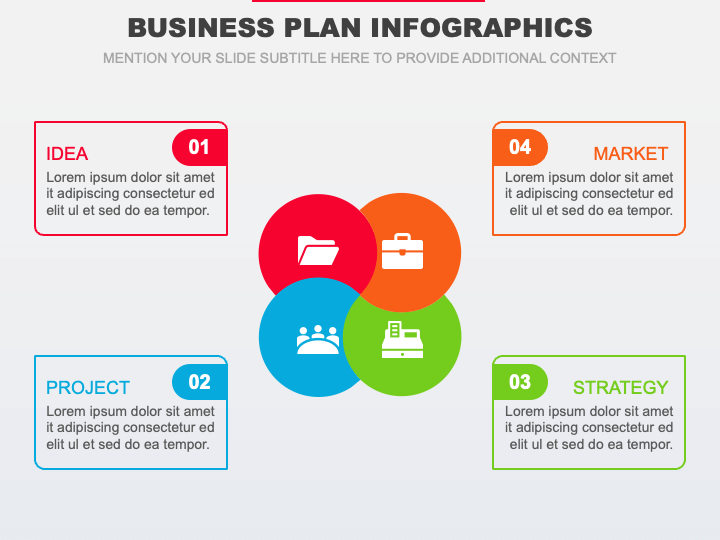
The slides feature captivating infographics of a clipboard, a Venn diagram, quadrilateral-shaped boxes, self-explanatory icons with percentage signs, stairs with a dartboard with an arrow, a list infographic, and a pentagon-shaped infographic. The visuals are adorned with bright color contrasts and editable textual boxes.
Features
- Fuss-free editing
- High-quality graphics
- Copyright-free
- 24*7 customer support
Download this PPT to give an endearing touch to your presentations!