

Cavatast Presentation - Free Download
Cavatast Presentation - Free Download
(14 Editable Slides)

Related Presentation Templates


Each year, on the first weekend of October, Cavatast takes place in Sant Sadurní d'Anoia to celebrate the Cava, a Catalan wine similar to Champagne. This three-day-long festival provides an opportunity for visitors to taste a wide variety of cava from different producers, enjoy traditional cuisine, and participate in various competitions and activities related to sparkling wine. During this festival, live music, workshops, and exhibitions also take place, creating a lively and festive atmosphere.
Download our Cavatast template for PowerPoint and Google Slides to display more details about this cava festival. The blend of a serene background, bright color contrasts, and elegant typography makes the slides ideal for enhancing your presentation’s look.
Key Attributes of the Deck
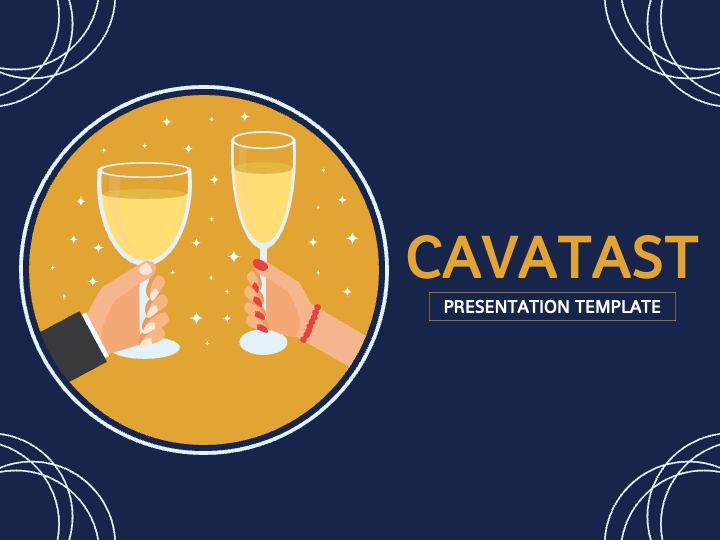
- Keep your audience engaged right from the beginning via our cover slide.
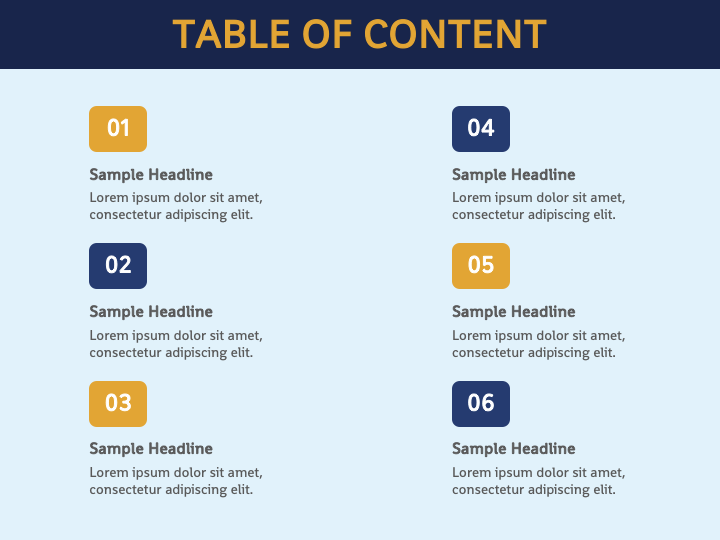
- Illustrate your presentation’s agenda through our Table of Contents slide.
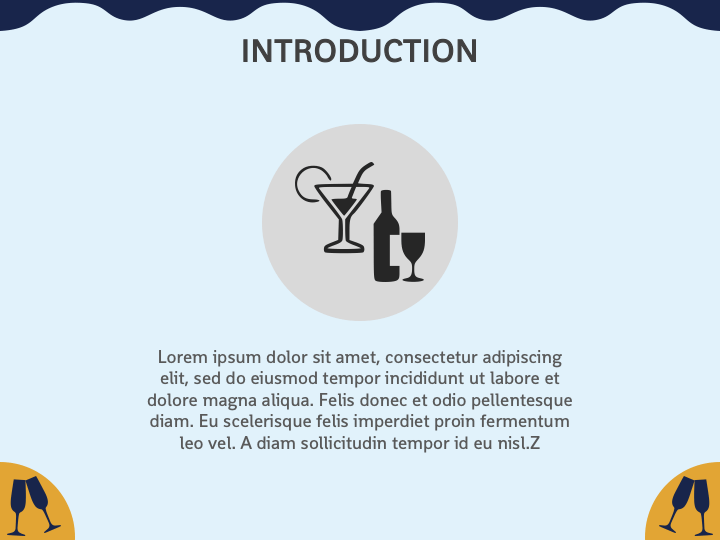
- Portray a concise overview of your presentation via an eye-pleasing infographic.
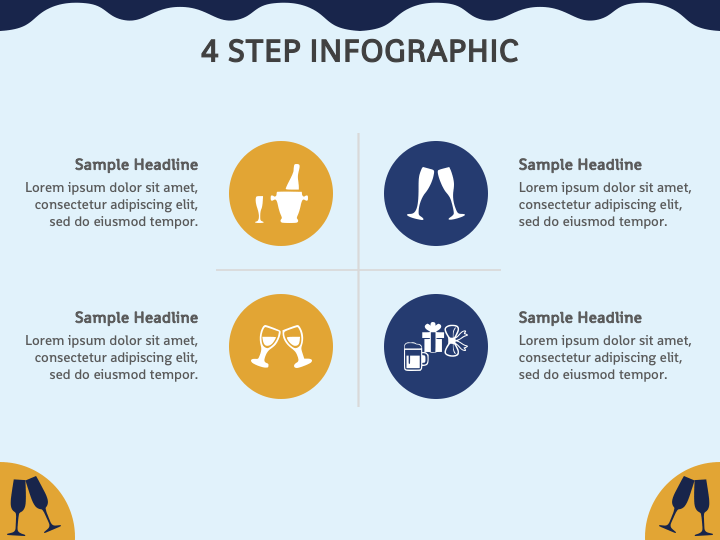
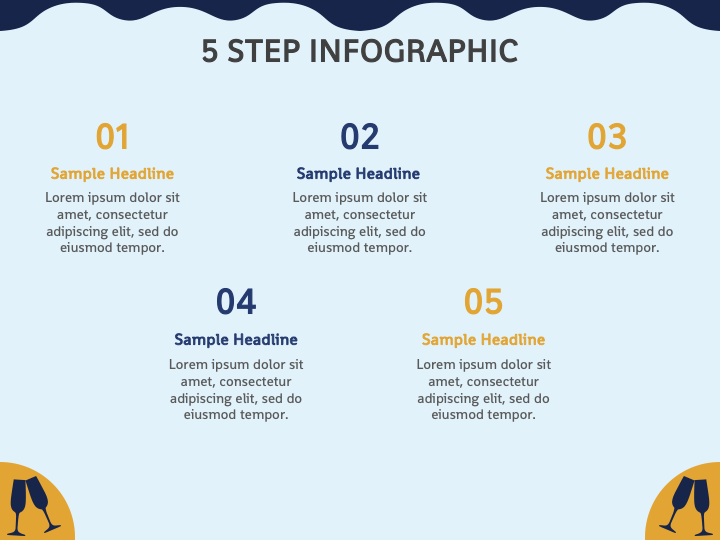
- Showcase festival highlights via four and five-step infographics.
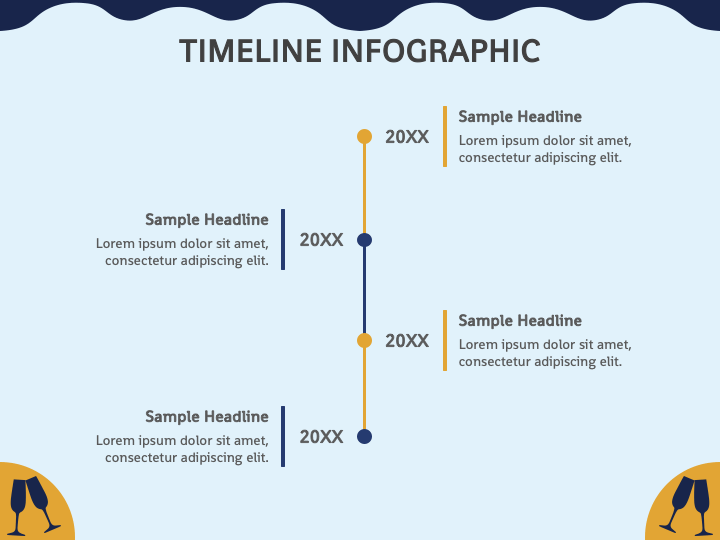
- Use the timeline graphic to depict the evolution of festivities over the years.
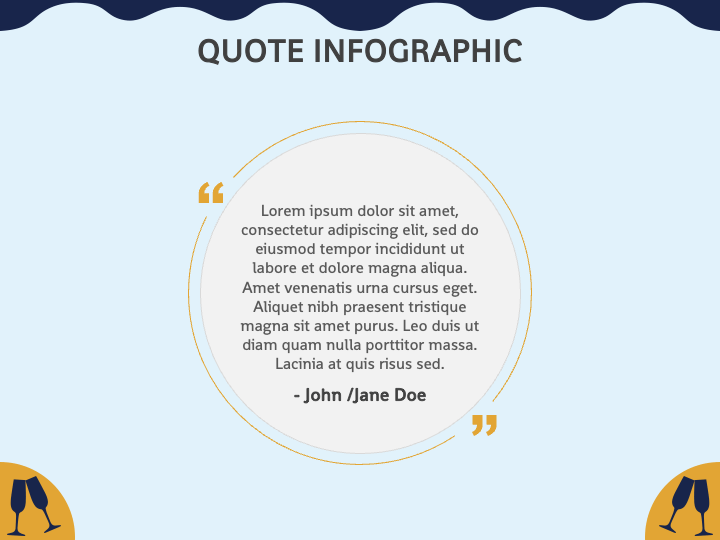
- A great saying about the festival can be illustrated via a quote infographic.
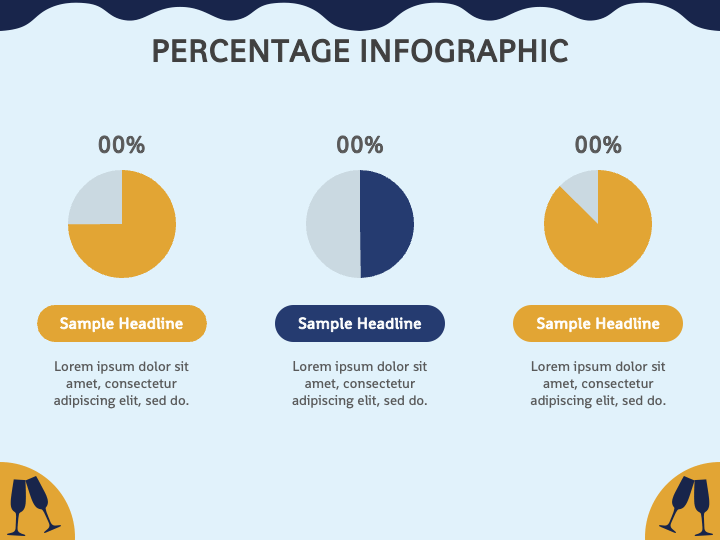
- Use pie charts to illustrate the percentage distribution of the most consumed cava.
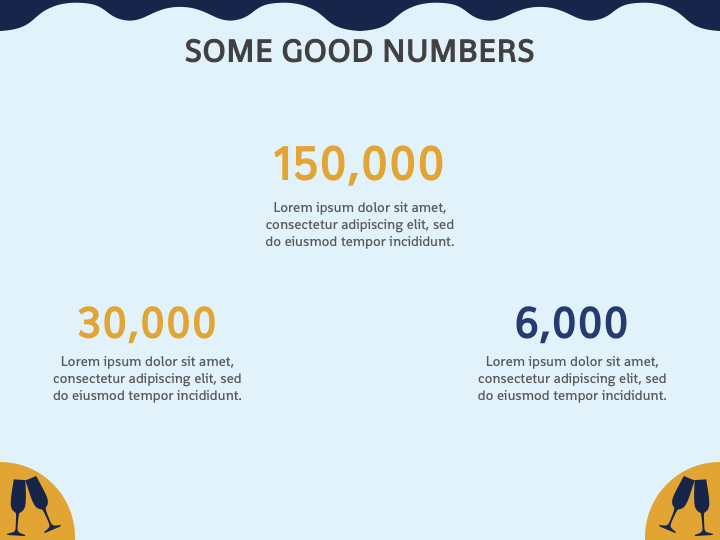
- Illustrate the amount of sparkling wines produced and consumed during this festival, the average number of attendees in the festivities, etc., via a stats layout.
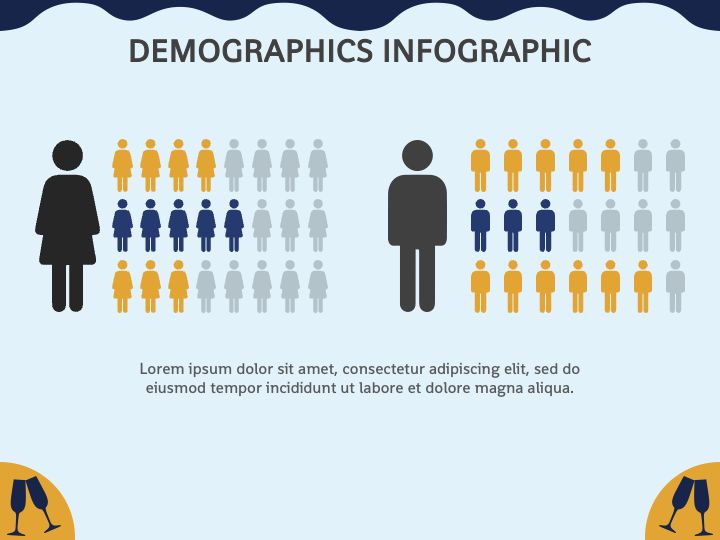
- Portray the distribution of attendees based on age and gender via a demographic infographic.
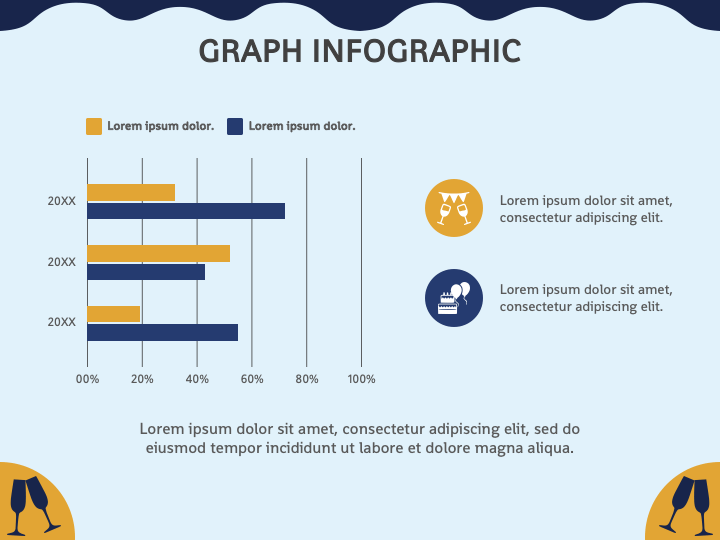
- Showcase the comparison of wine produced and consumed over the years via a bar graph.
- A ‘Thank You’ slide is provided to help you express gratitude for the audience’s undivided attention.
Features
- Customize the set components to suit your preferences without encountering restrictions.
- Project the illustrations on any screen size without compromising original quality or resolution.
- All attributes are thoughtfully crafted to eliminate the room for copyright violation issues.
Grab this PPT to deliver stylish yet informative presentations!